Mapped: Where Workers Outnumber Jobs in America
See visuals like this from many other data creators on our Voronoi app. Download it for free on iOS or Android and discover incredible data-driven charts from a variety of trusted sources.
Key Takeaways
- California has the toughest job market in America, with 184 workers for every 100 job openings.
- Several Plains states, including North Dakota and South Dakota, still have more job openings than available workers.
- The gap between states has become so large that where you live can dramatically affect how difficult it is to find work.
Finding a job in California is a very different experience from finding one in North Dakota.
In some states, workers far outnumber available positions, creating intense competition for every opening. In others, employers are still struggling to find enough people to hire.
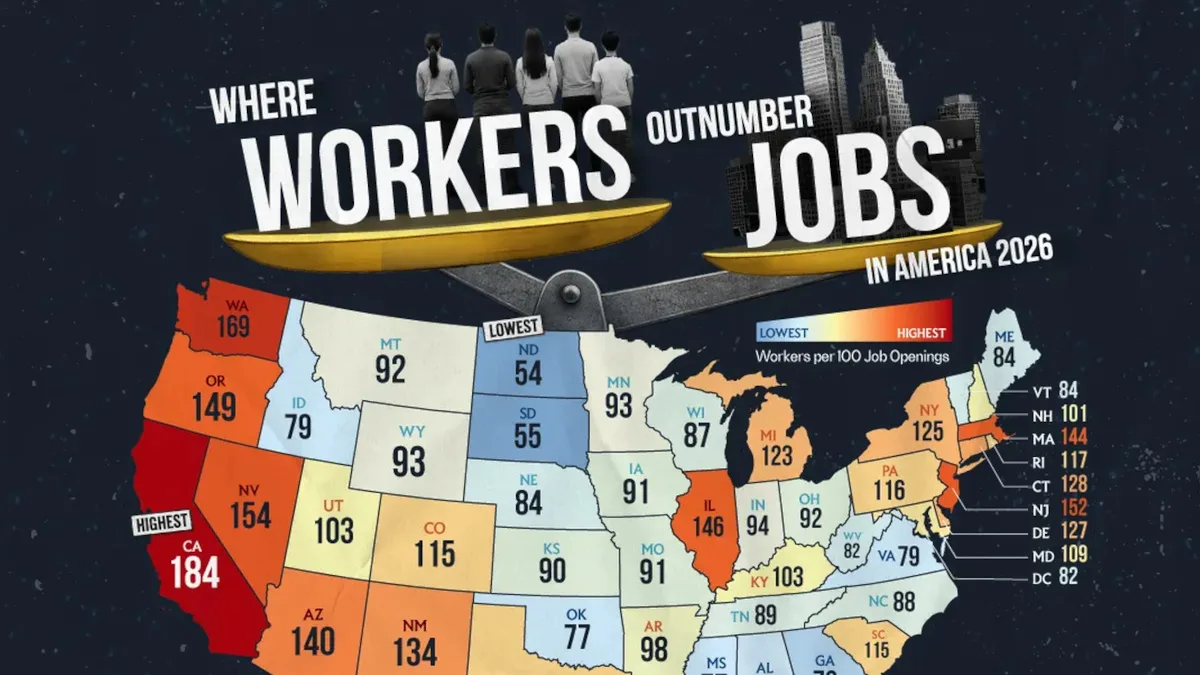
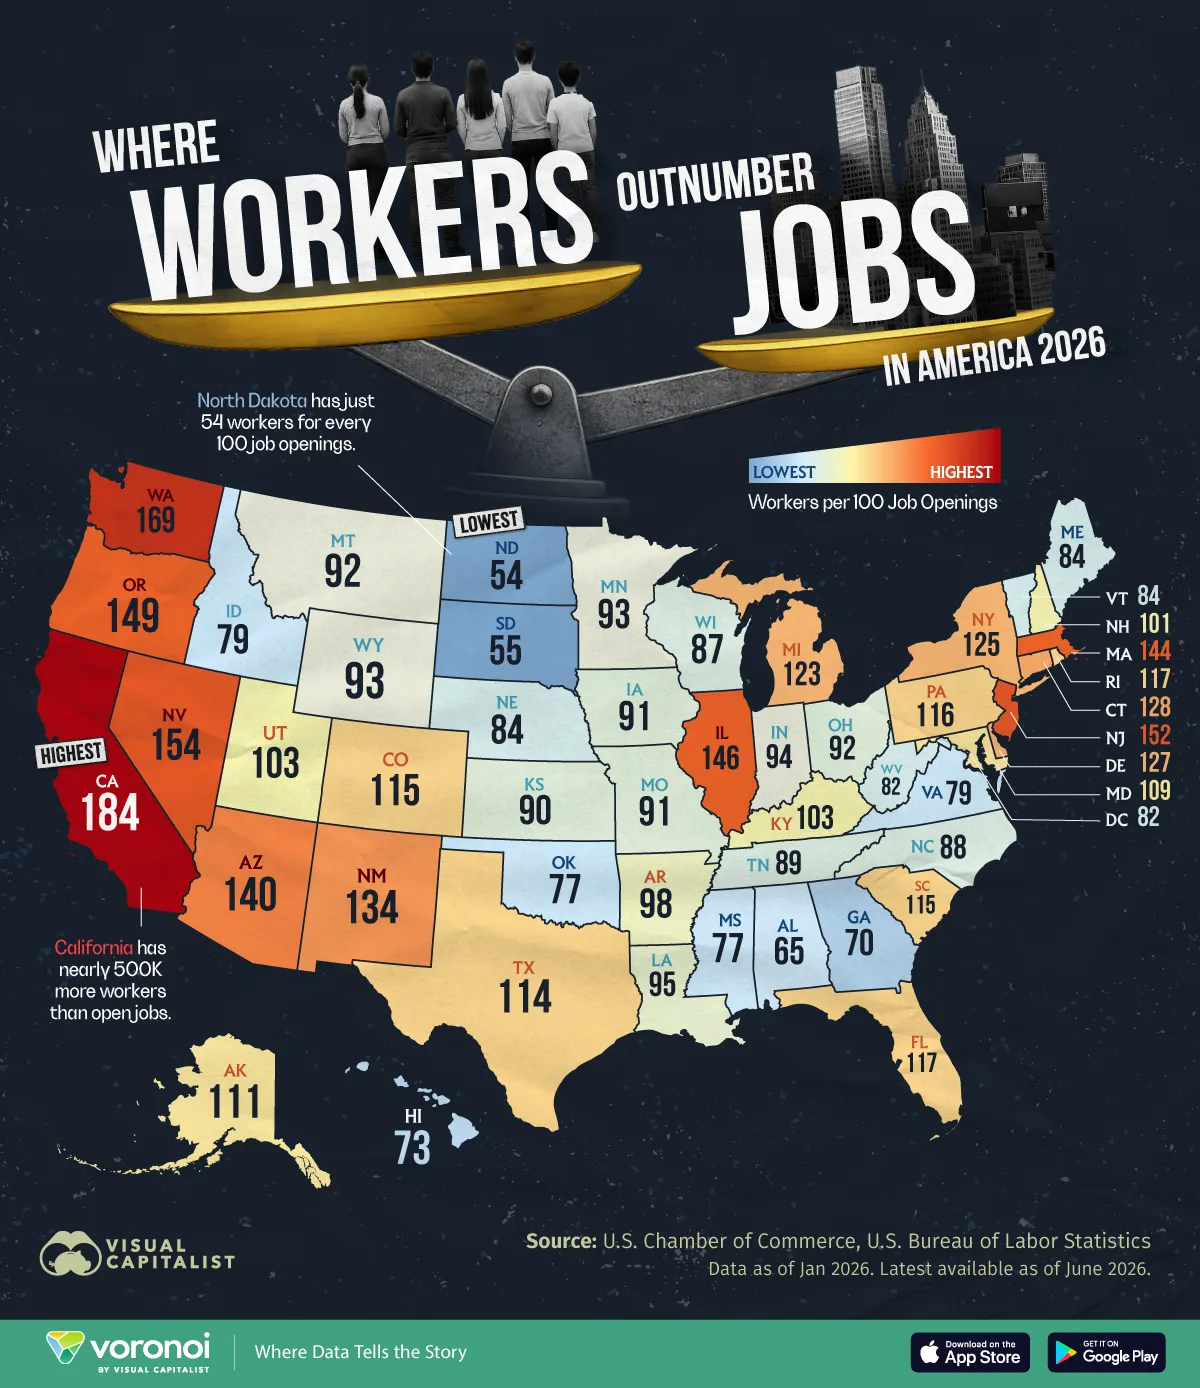
Using data from the U.S. Chamber of Commerce and Bureau of Labor Statistics, this map shows how many workers are available for every 100 job openings in each state as of January 2026.
The results reveal one of the sharpest geographic divides in the U.S. labor market, with California reporting 184 workers per 100 openings while North Dakota has just 54.
Ranked: Where Workers Outnumber Jobs in 2026
The following table shows the states with the highest labor surpluses and shortages in 2026:
| State | Workers per 100 Job Openings Jan 2026 |
Total Labor Surplus or Shortage |
|---|---|---|
| California | 184 | 494,000 |
| Washington | 169 | 83,000 |
| Nevada | 154 | 31,000 |
| New Jersey | 152 | 88,000 |
| Oregon | 149 | 38,000 |
| Illinois | 146 | 100,000 |
| Massachusetts | 144 | 57,000 |
| Arizona | 140 | 49,000 |
| New Mexico | 134 | 11,000 |
| Connecticut | 128 | 19,000 |
| Delaware | 127 | 6,000 |
| New York | 125 | 93,000 |
| Michigan | 123 | 47,000 |
| Florida | 117 | 72,000 |
| Rhode Island | 117 | 4,000 |
| Pennsylvania | 116 | 39,000 |
| Colorado | 115 | 16,000 |
| South Carolina | 115 | 17,000 |
| Texas | 114 | 85,000 |
| Alaska | 111 | 2,000 |
| Maryland | 109 | 11,000 |
| Kentucky | 103 | 2,000 |
| Utah | 103 | 2,000 |
| New Hampshire | 101 | 0 |
| Arkansas | 98 | -1,000 |
| Louisiana | 95 | -5,000 |
| Indiana | 94 | -8,000 |
| Minnesota | 93 | -11,000 |
| Wyoming | 93 | -1,000 |
| Montana | 92 | -2,000 |
| Ohio | 92 | -23,000 |
| Iowa | 91 | -6,000 |
| Missouri | 91 | -13,000 |
| Kansas | 90 | -7,000 |
| Tennessee | 89 | -15,000 |
| North Carolina | 88 | -28,000 |
| Wisconsin | 87 | -16,000 |
| Maine | 84 | -5,000 |
| Nebraska | 84 | -6,000 |
| Vermont | 84 | -2,000 |
| District of Columbia | 82 | -6,000 |
| West Virginia | 82 | -8,000 |
| Idaho | 79 | -10,000 |
| Virginia | 79 | -45,000 |
| Mississippi | 77 | -14,000 |
| Oklahoma | 77 | -23,000 |
| Hawaii | 73 | -6,000 |
| Georgia | 70 | -82,000 |
| Alabama | 65 | -34,000 |
| South Dakota | 55 | -9,000 |
| North Dakota | 54 | -10,000 |
Why America’s Most Educated States Have Tough Job Markets
Some of America’s most educated states also have some of the most competitive job markets.
California, Washington, Massachusetts, New Jersey, and New York attract large numbers of highly skilled workers, creating intense competition for white-collar roles. California alone has 184 workers for every 100 job openings, a labor surplus of nearly 500,000 people.
The challenge has grown as hiring has slowed across technology, finance, and professional services. Tech firms have announced more than 84,000 job cuts this year, adding even more competition to already crowded labor markets.
Recent graduates have also felt the slowdown. According to the New York Fed, 42% of new grads are underemployed, underscoring how tougher white-collar hiring conditions are affecting younger workers entering the labor force.
Job Openings Have Fallen by Millions Since 2022
America’s job market remains historically healthy, but it is far less favorable to workers than it was during the post-pandemic hiring boom. Job openings have fallen from 12.2 million in 2022 to 7.6 million today, reducing opportunities across many industries and increasing competition for available roles.
The slowdown extends beyond openings. Employers are also hiring at one of the slowest rates of the past decade, outside of April 2020, reducing opportunities for workers looking to change jobs or return to work.
The result is a labor market that remains healthy by historical standards, but feels far less dynamic than it did just a few years ago.
Why Employers Still Can’t Find Workers in the Plains and South
The picture looks very different across much of the Plains and parts of the South.
North Dakota and South Dakota remain among the few states where there are roughly twice as many job openings as available workers. They also have some of the lowest unemployment rates in the country.
Unlike many coastal labor markets, the challenge is not a lack of jobs. Employers across industries such as energy, agriculture, manufacturing, construction, and healthcare continue to report difficulty finding workers.
Slower population growth, outmigration of younger residents, and an aging workforce have limited labor supply, leaving employers competing for workers rather than workers competing for jobs.
Similar shortages persist across parts of the South. In Alabama, nearly three in 10 small businesses reported being unable to fill open positions in May, citing a lack of qualified applicants.
Geography Matters More Than Ever
For many workers, location may now be one of the biggest factors shaping job prospects.
States with large labor surpluses tend to see heavier competition for openings, while states with worker shortages often offer employers a much smaller hiring pool. The result is that two people with similar skills can face very different job markets depending on where they live.
As hiring slows nationally, those geographic differences are becoming increasingly important for workers deciding where to build their careers.
Learn More on the Voronoi App 
To learn more about this topic, check out this graphic on the cost of living by state.