Mapped: Which Countries Rely Most on Imports
See visuals like this from many other data creators on our Voronoi app. Download it for free on iOS or Android and discover incredible data-driven charts from a variety of trusted sources.
Key Takeaways
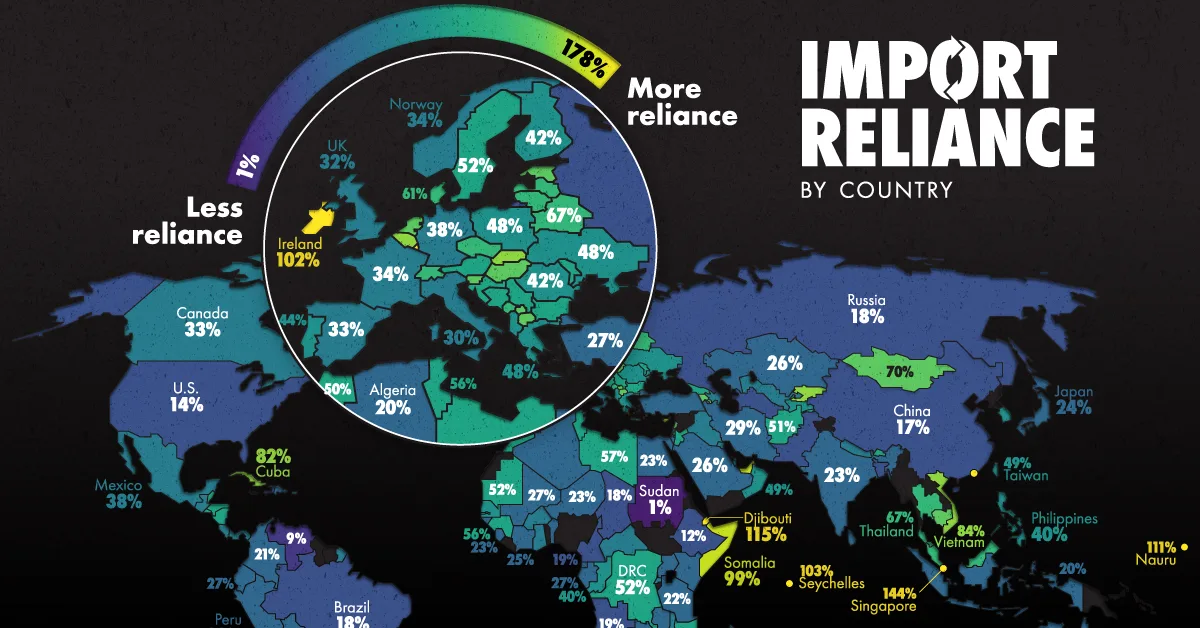
- Globally, imported goods and services are equal to 28% of GDP.
- Despite importing $3.4 trillion of goods, the U.S. has one of the lowest import-to-GDP ratios because of its massive and diverse economy.
- Several small island economies have extremely high import-to-GDP ratios, including Cuba (82%) and Taiwan (49%), given limited domestic production.
Global imports are valued at approximately 28% of GDP, with trillions of dollars in goods and services moving across borders each year.
In dozens of countries, imports exceed 50% of GDP, especially in trade-oriented nations and smaller economies. While elevated ratios are common in major trade hubs like Singapore and Hong Kong, they can also signal a heavier reliance on imported food and commodities.
This graphic shows import reliance by country, based on data from the World Bank.
Import Reliance Amid Global Uncertainty
Import dependence has become a central issue in foreign policy, as many countries work to de-risk their supply chains.
Among the biggest focus areas are critical minerals and advanced semiconductors. Beyond this, European countries have ramped up renewable energy to reduce reliance on Russian oil. As a whole, imports account for 46% of GDP across EU countries.
Below, we show goods and services imports as a share of GDP by country, with data as of 2024 (or the latest data available):
| Rank | Country | Imports as a Share of GDP (%) |
|---|---|---|
| 1 |  Hong Kong SAR Hong Kong SAR |
178 |
| 2 |  Luxembourg Luxembourg |
160 |
| 3 |  San Marino San Marino |
155 |
| 4 |  Singapore Singapore |
144 |
| 5 |  Djibouti Djibouti |
115 |
| 6 |  Nauru Nauru |
111 |
| 7 |  Seychelles Seychelles |
103 |
| 8 |  Ireland Ireland |
102 |
| 9 |  Kiribati Kiribati |
102 |
| 10 |  Malta Malta |
100 |
| 11 |  Somalia Somalia |
99 |
| 12 |  Lesotho Lesotho |
99 |
| 13 |  Cyprus Cyprus |
93 |
| 14 |  UAE UAE |
92 |
| 15 |  Slovak Republic Slovak Republic |
86 |
| 16 |  Timor-Leste Timor-Leste |
85 |
| 17 |  Kyrgyz Republic Kyrgyz Republic |
84 |
| 18 |  Vietnam Vietnam |
84 |
| 19 |  Cuba Cuba |
82 |
| 20 |  Marshall Islands Marshall Islands |
82 |
| 21 |  Palau Palau |
80 |
| 22 |  Belgium Belgium |
80 |
| 23 |  Mauritius Mauritius |
78 |
| 24 |  Maldives Maldives |
78 |
| 25 |  Armenia Armenia |
76 |
| 26 |  Aruba Aruba |
76 |
| 27 |  Estonia Estonia |
75 |
| 28 |  Slovenia Slovenia |
75 |
| 29 |  North Macedonia North Macedonia |
75 |
| 30 |  Lebanon Lebanon |
74 |
| 31 |  Cambodia Cambodia |
72 |
| 32 |  Kosovo Kosovo |
72 |
| 33 |  Micronesia Micronesia |
71 |
| 34 |  Netherlands Netherlands |
71 |
| 35 |  Hungary Hungary |
71 |
| 36 |  Solomon Islands Solomon Islands |
71 |
| 37 |  Bahrain Bahrain |
70 |
| 38 |  Mongolia Mongolia |
70 |
| 39 |  Lithuania Lithuania |
69 |
| 40 |  Namibia Namibia |
68 |
| 41 |  Latvia Latvia |
67 |
| 42 |  Belarus Belarus |
67 |
| 43 |  Thailand Thailand |
67 |
| 44 |  Montenegro Montenegro |
66 |
| 45 |  Malaysia Malaysia |
66 |
| 46 |  Tonga Tonga |
65 |
| 47 |  Czechia Czechia |
63 |
| 48 |  Switzerland Switzerland |
62 |
| 49 |  Denmark Denmark |
61 |
| 50 |  West Bank and Gaza West Bank and Gaza |
60 |
| 51 |  Brunei Darussalam Brunei Darussalam |
58 |
| 52 |  Serbia Serbia |
58 |
| 53 |  Nicaragua Nicaragua |
58 |
| 54 |  Honduras Honduras |
58 |
| 55 |  Moldova Moldova |
57 |
| 56 |  Jordan Jordan |
57 |
| 57 |  Libya Libya |
57 |
| 58 |  Guinea Guinea |
56 |
| 59 |  Tunisia Tunisia |
56 |
| 60 |  Georgia Georgia |
56 |
| 61 |  Croatia Croatia |
55 |
| 62 |  Bosnia and Herzegovina Bosnia and Herzegovina |
54 |
| 63 |  Cabo Verde Cabo Verde |
54 |
| 64 |  Bulgaria Bulgaria |
54 |
| 65 |  Belize Belize |
54 |
| 66 |  Eswatini Eswatini |
54 |
| 67 |  Bhutan Bhutan |
53 |
| 68 |  Austria Austria |
53 |
| 69 |  Mozambique Mozambique |
53 |
| 70 |  Mauritania Mauritania |
52 |
| 71 |  El Salvador El Salvador |
52 |
| 72 |  DR Congo DR Congo |
52 |
| 73 |  Sweden Sweden |
52 |
| 74 |  Faroe Islands Faroe Islands |
51 |
| 75 |  Greenland Greenland |
51 |
| 76 |  Afghanistan Afghanistan |
51 |
| 77 |  Morocco Morocco |
50 |
| 78 |  Macao SAR Macao SAR |
50 |
| 79 |  Taiwan Taiwan |
49 |
| 80 |  Samoa Samoa |
49 |
| 81 |  Oman Oman |
49 |
| 82 |  Tajikistan Tajikistan |
48 |
| 83 |  Ukraine Ukraine |
48 |
| 84 |  Poland Poland |
48 |
| 85 |  Greece Greece |
48 |
| 86 |  French Polynesia French Polynesia |
46 |
| 87 |  Portugal Portugal |
44 |
| 88 |  Botswana Botswana |
44 |
| 89 |  Iceland Iceland |
44 |
| 90 |  Senegal Senegal |
43 |
| 91 |  Albania Albania |
43 |
| 92 |  Puerto Rico (US) Puerto Rico (US) |
43 |
| 93 |  Romania Romania |
42 |
| 94 |  Finland Finland |
42 |
| 95 |  Bahamas Bahamas |
41 |
| 96 |  Congo Congo |
40 |
| 97 |  South Korea South Korea |
40 |
| 98 |  Philippines Philippines |
40 |
| 99 |  Paraguay Paraguay |
40 |
| 100 |  Panama Panama |
39 |
| 101 |  Rwanda Rwanda |
39 |
| 102 |  Kuwait Kuwait |
38 |
| 103 |  Uzbekistan Uzbekistan |
38 |
| 104 |  Mexico Mexico |
38 |
| 105 |  Germany Germany |
38 |
| 106 |  Azerbaijan Azerbaijan |
37 |
| 107 |  Comoros Comoros |
34 |
| 108 |  Ghana Ghana |
34 |
| 109 |  France France |
34 |
| 110 |  Norway Norway |
34 |
| 111 |  Gambia Gambia |
33 |
| 112 |  Iraq Iraq |
33 |
| 113 |  Nepal Nepal |
33 |
| 114 |  Spain Spain |
33 |
| 115 |  Costa Rica Costa Rica |
33 |
| 116 |  Canada Canada |
33 |
| 117 |  Qatar Qatar |
32 |
| 118 |  Burkina Faso Burkina Faso |
32 |
| 119 |  United Kingdom United Kingdom |
32 |
| 120 |  Madagascar Madagascar |
32 |
| 121 |  Guatemala Guatemala |
31 |
| 122 |  Central African Republic Central African Republic |
31 |
| 123 |  Malawi Malawi |
31 |
| 124 |  Italy Italy |
30 |
| 125 |  Chile Chile |
30 |
| 126 |  South Africa South Africa |
30 |
| 127 |  Dominican Republic Dominican Republic |
29 |
| 128 |  New Caledonia New Caledonia |
29 |
| 129 |  Iran Iran |
29 |
| 130 |  Zambia Zambia |
28 |
| 131 |  Gabon Gabon |
27 |
| 132 |  Mali Mali |
27 |
| 133 |  Turkiye Turkiye |
27 |
| 134 |  Guinea-Bissau Guinea-Bissau |
27 |
| 135 |  Ecuador Ecuador |
27 |
| 136 |  New Zealand New Zealand |
26 |
| 137 |  Israel Israel |
26 |
| 138 |  Uganda Uganda |
26 |
| 139 |  Kazakhstan Kazakhstan |
26 |
| 140 |  Saudi Arabia Saudi Arabia |
26 |
| 141 |  Bolivia Bolivia |
26 |
| 142 |  Equatorial Guinea Equatorial Guinea |
25 |
| 143 |  Cote d’Ivoire Cote d’Ivoire |
25 |
| 144 |  Uruguay Uruguay |
24 |
| 145 |  Japan Japan |
24 |
| 146 |  India India |
23 |
| 147 |  Zimbabwe Zimbabwe |
23 |
| 148 |  Sierra Leone Sierra Leone |
23 |
| 149 |  Egypt, Egypt, |
23 |
| 150 |  Bermuda Bermuda |
23 |
| 151 |  Kenya Kenya |
23 |
| 152 |  Peru Peru |
23 |
| 153 |  Niger Niger |
23 |
| 154 |  Australia Australia |
23 |
| 155 |  Sri Lanka Sri Lanka |
23 |
| 156 |  Benin Benin |
22 |
| 157 |  Tanzania Tanzania |
22 |
| 158 |  Colombia Colombia |
21 |
| 159 |  Indonesia Indonesia |
20 |
| 160 |  Algeria Algeria |
20 |
| 161 |  Angola Angola |
19 |
| 162 |  Haiti Haiti |
19 |
| 163 |  Cameroon Cameroon |
19 |
| 164 |  Chad Chad |
18 |
| 165 |  Brazil Brazil |
18 |
| 166 |  Russia Russia |
18 |
| 167 |  Pakistan Pakistan |
17 |
| 168 |  China China |
17 |
| 169 |  Bangladesh Bangladesh |
16 |
| 170 |  United States United States |
14 |
| 171 |  Argentina Argentina |
13 |
| 172 |  Ethiopia Ethiopia |
12 |
| 173 |  Turkmenistan Turkmenistan |
11 |
| 174 |  Venezuela Venezuela |
9 |
| 175 |  Sudan Sudan |
1 |
Hong Kong has the highest import-to-GDP ratio in the world at 178%, driven largely by its role as a major re-export hub.
More than half of these re-exported goods originate in China, passing through Hong Kong before being shipped to the rest of the world. In total, the value of Hong Kong’s re-exports exceeds half a trillion dollars.
Singapore, with an import-to-GDP ratio of 144%, is similarly a key re-export—or entrepôt—economy.
Meanwhile, island nations such as Cyprus, Cuba, and Taiwan tend to be more import-dependent due to limited domestic production. In Cuba, up to 80% of food is imported, mainly from the Netherlands and Spain.
Moreover, Taiwan is heavily reliant on imported energy, with most of its oil shipped from the Middle East. The country also imports billions of dollars’ worth of oil derivatives from Russia, which are essential inputs in semiconductor manufacturing.
In North America, Mexico has the highest import-to-GDP ratio at 38%, followed by Canada at 33%. Despite recording $3.4 trillion in imports in 2024, the U.S. has the sixth-lowest import dependence globally, at 14%, given the sheer size of its economy and diverse domestic production.
Also sitting at the bottom are Sudan (1%) and Venezuela (9%), where ongoing crises and corruption have severely disrupted trade flows.
Learn More on the Voronoi App 
To learn more about this topic, check out this graphic on the world’s biggest exporters.