Mapped: Which States Grew Fastest Since 2021
See visuals like this from many other data creators on our Voronoi app. Download it for free on iOS or Android and discover incredible data-driven charts from a variety of trusted sources.
Key Takeaways
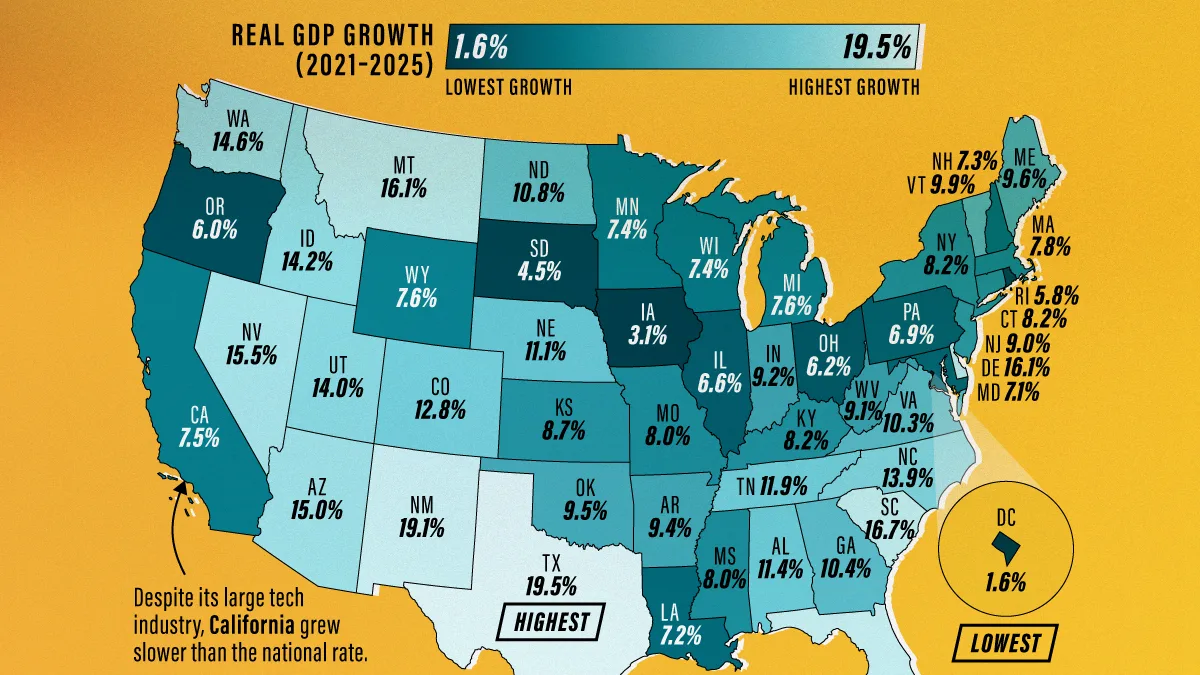
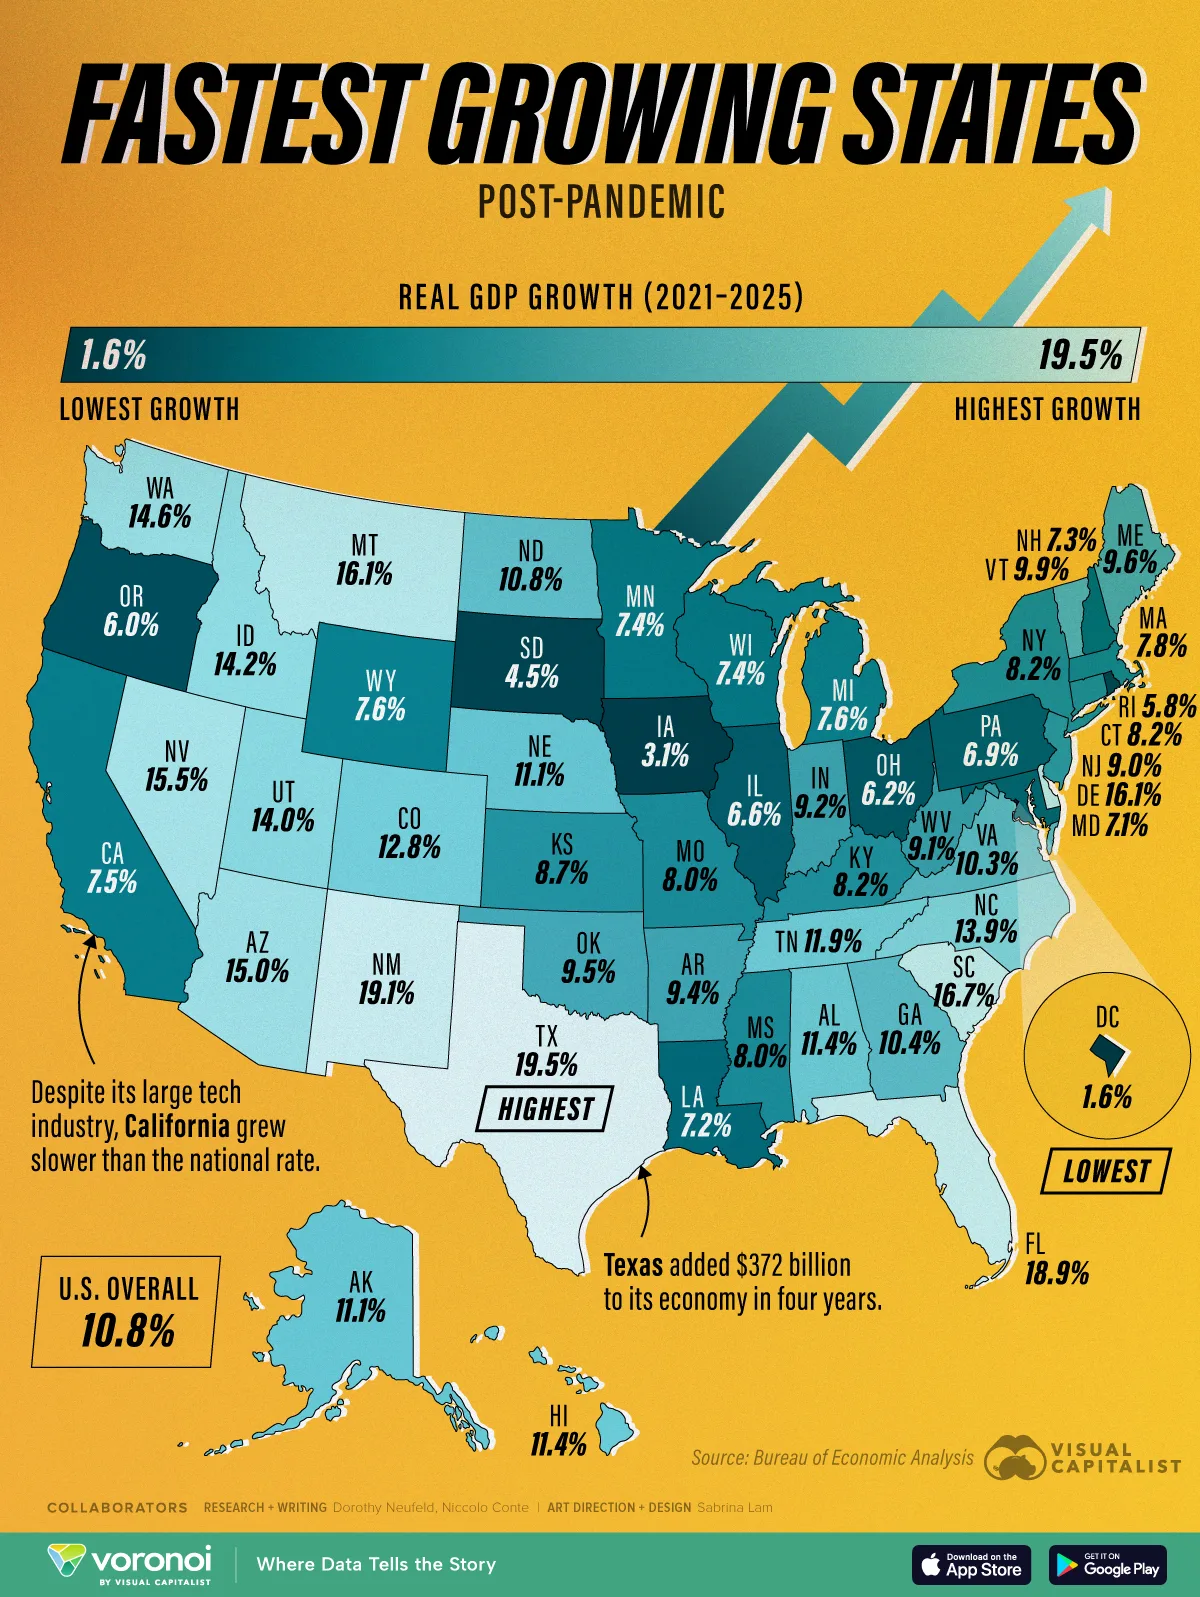
- Texas posted the strongest economic growth of any state, expanding 19.5% in real terms since 2021.
- California grew just 7.5%, trailing the national average despite leading the AI boom.
- Economic growth varied dramatically across the country, with Texas expanding more than 12 times faster than Washington, D.C.
The post-pandemic economy reshaped America’s growth map.
While Texas and Florida surged ahead, many states struggled to keep pace with the national average. Even California, the country’s largest state economy and the epicenter of the AI boom, grew more slowly than America as a whole.
The map above shows cumulative real GDP growth by state between 2021 and 2025 based on data from the Bureau of Economic Analysis, revealing where economic momentum has been strongest over the last several years.
The States Leading America’s Growth Boom
Texas was the fastest-growing state economy over the period.
Its real GDP expanded by nearly 20% between 2021 and 2025, adding roughly $372 billion in output. That increase alone was almost as large as the combined gains of California and New York, highlighting the state’s growing role in the U.S. economy.
| Rank | State or District | Real GDP Growth (2021-2025) |
|---|---|---|
| 1 | Texas | 19.5% |
| 2 | New Mexico | 19.1% |
| 3 | Florida | 18.9% |
| 4 | South Carolina | 16.7% |
| 5 | Montana | 16.1% |
| 6 | Delaware | 16.1% |
| 7 | Nevada | 15.5% |
| 8 | Arizona | 15.0% |
| 9 | Washington | 14.6% |
| 10 | Idaho | 14.2% |
| 11 | Utah | 14.0% |
| 12 | North Carolina | 13.9% |
| 13 | Colorado | 12.8% |
| 14 | Tennessee | 11.9% |
| 15 | Alabama | 11.4% |
| 16 | Hawaii | 11.4% |
| 17 | Nebraska | 11.1% |
| 18 | Alaska | 11.1% |
| 19 | North Dakota | 10.8% |
| 20 | Georgia | 10.4% |
| 21 | Virginia | 10.3% |
| 22 | Vermont | 9.9% |
| 23 | Maine | 9.6% |
| 24 | Oklahoma | 9.5% |
| 25 | Arkansas | 9.4% |
| 26 | Indiana | 9.2% |
| 27 | West Virginia | 9.1% |
| 28 | New Jersey | 9.0% |
| 29 | Kansas | 8.7% |
| 30 | Kentucky | 8.2% |
| 31 | New York | 8.2% |
| 32 | Connecticut | 8.2% |
| 33 | Mississippi | 8.0% |
| 34 | Missouri | 8.0% |
| 35 | Massachusetts | 7.8% |
| 36 | Michigan | 7.6% |
| 37 | Wyoming | 7.6% |
| 38 | California | 7.5% |
| 39 | Wisconsin | 7.4% |
| 40 | Minnesota | 7.4% |
| 41 | New Hampshire | 7.3% |
| 42 | Louisiana | 7.2% |
| 43 | Maryland | 7.1% |
| 44 | Pennsylvania | 6.9% |
| 45 | Illinois | 6.6% |
| 46 | Ohio | 6.2% |
| 47 | Oregon | 6.0% |
| 48 | Rhode Island | 5.8% |
| 49 | South Dakota | 4.5% |
| 50 | Iowa | 3.1% |
| 51 | District of Columbia | 1.6% |
| — |  United States United States |
10.8% |
New Mexico followed closely at 19.1%, while Florida ranked third at 18.9%. Many other Sun Belt states also posted strong gains, including South Carolina, Nevada, Arizona, and Utah. Overall, only 18 states grew faster than the national average of 10.8%.
A clear geographic pattern emerges from the rankings. Many of the fastest-growing states were located in the South and Mountain West, while much of the Northeast and Midwest expanded more slowly. Business investment, population growth, and energy production helped drive many of the top-performing states.
Why the Sun Belt Dominated
Many of the strongest-performing states shared similar advantages.
Texas and New Mexico benefited from expanding energy production, while Florida, Arizona, and the Carolinas continued attracting residents and businesses from higher-cost states. As people move in, demand rises for housing, healthcare, retail, and infrastructure, creating a powerful economic multiplier.
Overall, Texas added over 2.5 million residents between 2020 and 2025, while Florida added more than 1.9 million. North Carolina gained more than 750,000 residents, the third-largest increase in the country, supported by relatively affordable housing and a diverse economic base.
The shift began before COVID, but the pandemic accelerated it. Remote work allowed more Americans to relocate, while companies increasingly expanded into lower-cost markets with faster-growing labor forces.
As a result, many Sun Belt states entered the second half of the decade with stronger economic momentum than much of the Northeast and Midwest.
California’s Surprising Position
California’s position stands out in the rankings.
Despite being America’s largest state economy and home to many of the world’s most valuable technology companies, California’s economy grew just 7.5% between 2021 and 2025, well below the national average.
That result is notable given California’s outsized role in artificial intelligence, venture capital, and software development. The state remains an economic powerhouse, but its growth rate lagged behind many faster-growing states in the South and Mountain West.
California’s ranking highlights an important distinction: the largest economies are not always the fastest-growing. While California remains America’s biggest state economy and a global technology hub, mature economies often grow more slowly than states benefiting from rapid population gains and new business investment.
The States That Fell Furthest Behind
Not every state shared in the post-pandemic boom.
Iowa’s economy expanded just 3.1%, while South Dakota grew 4.5%. Rhode Island, Oregon, Ohio, and Illinois also posted below-average gains.
The slowest growth was recorded in Washington, D.C., where real GDP increased only 1.6% between 2021 and 2025.
The contrast with the fastest-growing states was dramatic. Texas grew more than 12 times faster than Washington, D.C. over the same period, underscoring how uneven America’s economic expansion has been across regions.
Learn More on the Voronoi App 
To learn more about this topic, check out this graphic showing where Americans keep the most income after bills.