Which U.S. States Gained the Most People From Abroad
See visuals like this from many other data creators on our Voronoi app. Download it for free on iOS or Android and discover incredible data-driven charts from a variety of trusted sources.
Key Takeaways
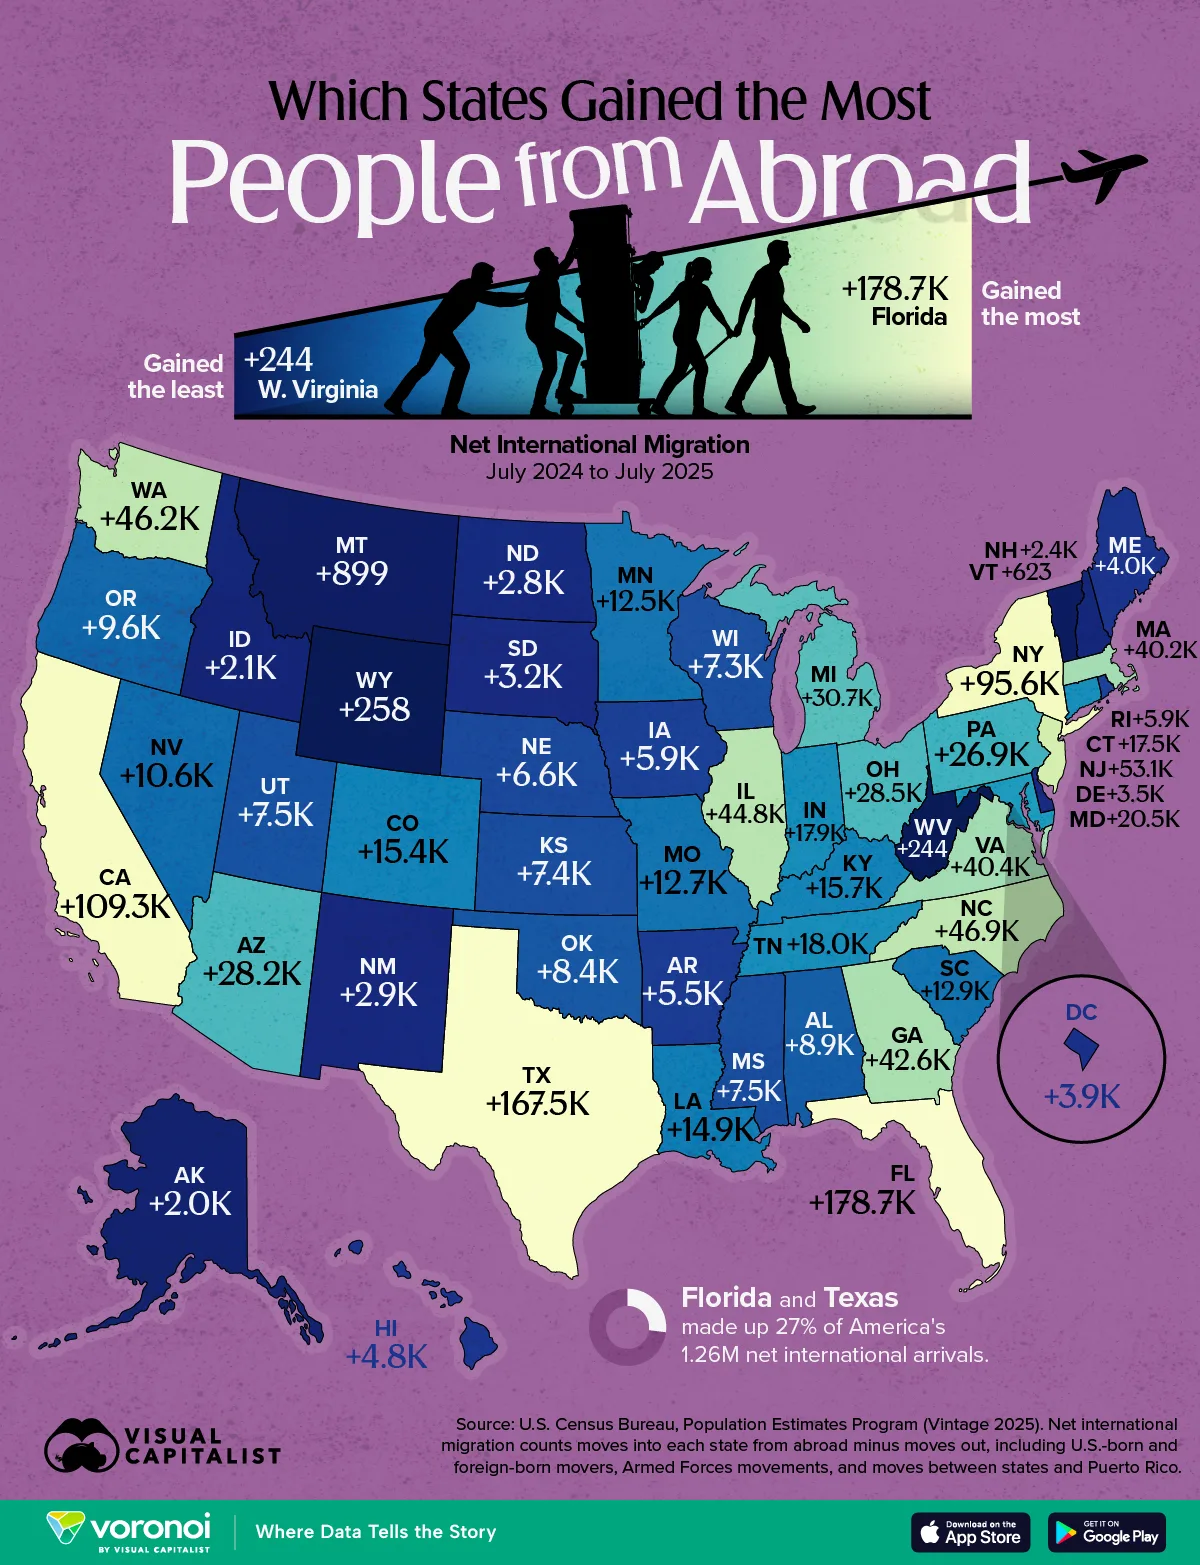
- Florida (+178,674) and Texas (+167,475) attracted more people from abroad than the next four states combined, accounting for 27% of all U.S. net international migration.
- Every U.S. state and Washington, D.C. posted a net gain from international migration in 2025, despite a historic nationwide slowdown.
- The 20 lowest-ranked states combined added fewer international migrants than New York alone.
Immigration has been one of the defining demographic stories of the past several years, but new Census Bureau estimates show that the pace slowed dramatically in 2025.
Net international migration fell from 2.7 million to 1.3 million during the year ending July 1, a historic decline according to the U.S. Census Bureau. Even so, every state still posted a net gain from abroad, with nearly half of all arrivals concentrated in just five states.
The data for this visualization comes from the U.S. Census Bureau’s Vintage 2025 population estimates, which measure net international migration into each state. This includes foreign-born and U.S.-born movers, Armed Forces movements, and migration between states and Puerto Rico.
Florida and Texas Lead by a Wide Margin
Florida added 178,674 people from abroad in 2025, the most of any state, followed closely by Texas at 167,475.
| Rank | State | Net International Migration (2024-2025) | Share of U.S. Total |
|---|---|---|---|
| 1 | Florida | +178.7K | 14.2% |
| 2 | Texas | +167.5K | 13.3% |
| 3 | California | +109.3K | 8.7% |
| 4 | New York | +95.6K | 7.6% |
| 5 | New Jersey | +53.1K | 4.2% |
| 6 | North Carolina | +46.9K | 3.7% |
| 7 | Washington | +46.2K | 3.7% |
| 8 | Illinois | +44.8K | 3.5% |
| 9 | Georgia | +42.6K | 3.4% |
| 10 | Virginia | +40.4K | 3.2% |
| 11 | Massachusetts | +40.2K | 3.2% |
| 12 | Michigan | +30.7K | 2.4% |
| 13 | Ohio | +28.5K | 2.3% |
| 14 | Arizona | +28.2K | 2.2% |
| 15 | Pennsylvania | +26.9K | 2.1% |
| 16 | Maryland | +20.5K | 1.6% |
| 17 | Tennessee | +18.0K | 1.4% |
| 18 | Indiana | +17.9K | 1.4% |
| 19 | Connecticut | +17.5K | 1.4% |
| 20 | Kentucky | +15.7K | 1.2% |
| 21 | Colorado | +15.4K | 1.2% |
| 22 | Louisiana | +14.9K | 1.2% |
| 23 | South Carolina | +12.9K | 1.0% |
| 24 | Missouri | +12.7K | 1.0% |
| 25 | Minnesota | +12.5K | 1.0% |
| 26 | Nevada | +10.6K | 0.8% |
| 27 | Oregon | +9.6K | 0.8% |
| 28 | Alabama | +8.9K | 0.7% |
| 29 | Oklahoma | +8.4K | 0.7% |
| 30 | Utah | +7.5K | 0.6% |
| 31 | Mississippi | +7.5K | 0.6% |
| 32 | Kansas | +7.4K | 0.6% |
| 33 | Wisconsin | +7.3K | 0.6% |
| 34 | Nebraska | +6.6K | 0.5% |
| 35 | Rhode Island | +5.9K | 0.5% |
| 36 | Iowa | +5.9K | 0.5% |
| 37 | Arkansas | +5.5K | 0.4% |
| 38 | Hawaii | +4.8K | 0.4% |
| 39 | Maine | +4.0K | 0.3% |
| 40 | District of Columbia | +3.9K | 0.3% |
| 41 | Delaware | +3.5K | 0.3% |
| 42 | South Dakota | +3.2K | 0.3% |
| 43 | New Mexico | +2.9K | 0.2% |
| 44 | North Dakota | +2.8K | 0.2% |
| 45 | New Hampshire | +2.4K | 0.2% |
| 46 | Idaho | +2.1K | 0.2% |
| 47 | Alaska | +2.0K | 0.2% |
| 48 | Montana | +899 | 0.1% |
| 49 | Vermont | +623 | <0.1% |
| 50 | Wyoming | +258 | <0.1% |
| 51 | West Virginia | +244 | <0.1% |
Together, the two states accounted for 27% of the country’s net international migration total, more than the next four largest gainers combined: California, New York, New Jersey, and North Carolina.
California ranked third at 109,278, followed by New York (95,634) and New Jersey (53,064).
These five states alone accounted for nearly half of all net international arrivals nationwide, underscoring how concentrated international migration remains in a small number of large, historically immigrant-heavy states.
A Historic National Slowdown
The scale of these state gains looks different against the national backdrop.
Net international migration to the U.S. dropped from 2.7 million in 2024 to 1.3 million in 2025, a decline the Census Bureau describes as historic.
That slowdown follows several years in which immigration had become the dominant driver of U.S. population growth. In a recent Visual Capitalist analysis, immigration accounted for the vast majority of state population gains between 2021 and 2025, fully offsetting domestic population losses in more than a dozen states.
Even with the sharp pullback, the direction of the data did not reverse: no state recorded a net loss of residents to abroad in 2025. The slowdown shows up in the size of the gains, not their existence.
Every State Still Gained, But Some Barely Moved the Needle
At the other end of the spectrum, West Virginia (+244), Wyoming (+258), Vermont (+623), and Montana (+899) posted the smallest net gains from abroad.
In fact, the 20 lowest-ranked states combined added just 72,197 people from abroad, fewer than New York added on its own (95,634).
The rankings highlight how concentrated international migration remains. A relatively small group of large coastal and Sun Belt states continues to attract most new arrivals, while much of the country experiences only modest gains, even when every state is moving in the same direction.
Learn More on the Voronoi App 
If you enjoyed today’s post, check out Immigration’s Role in U.S. State Population Growth on Voronoi.