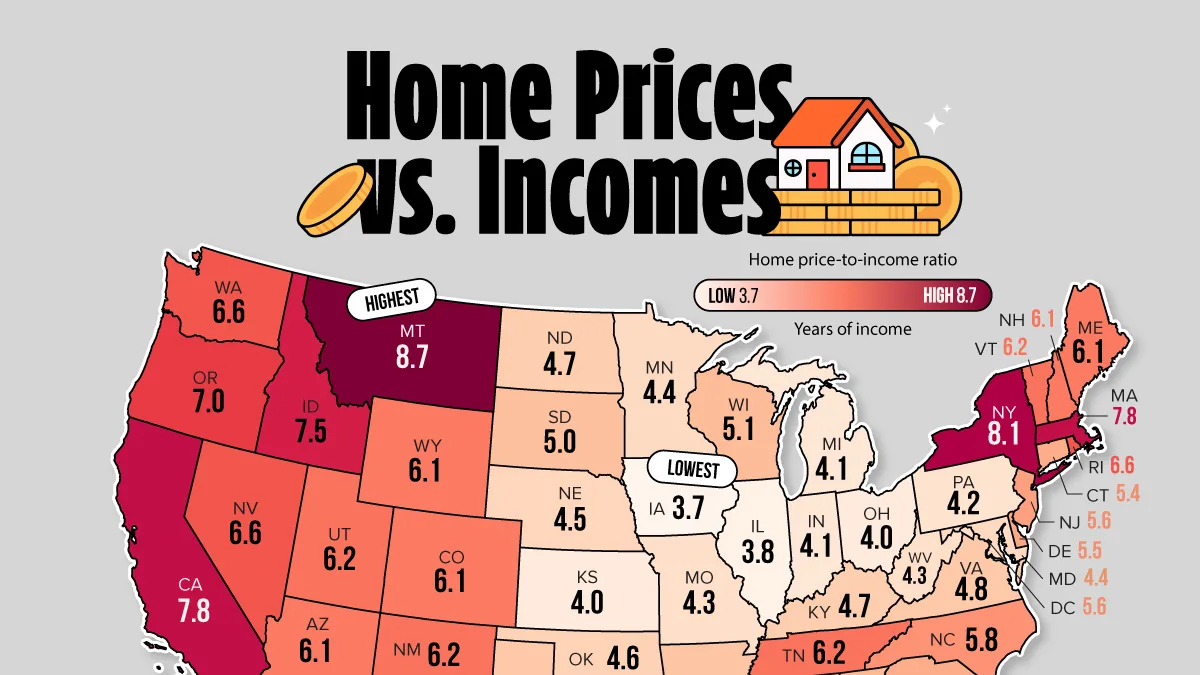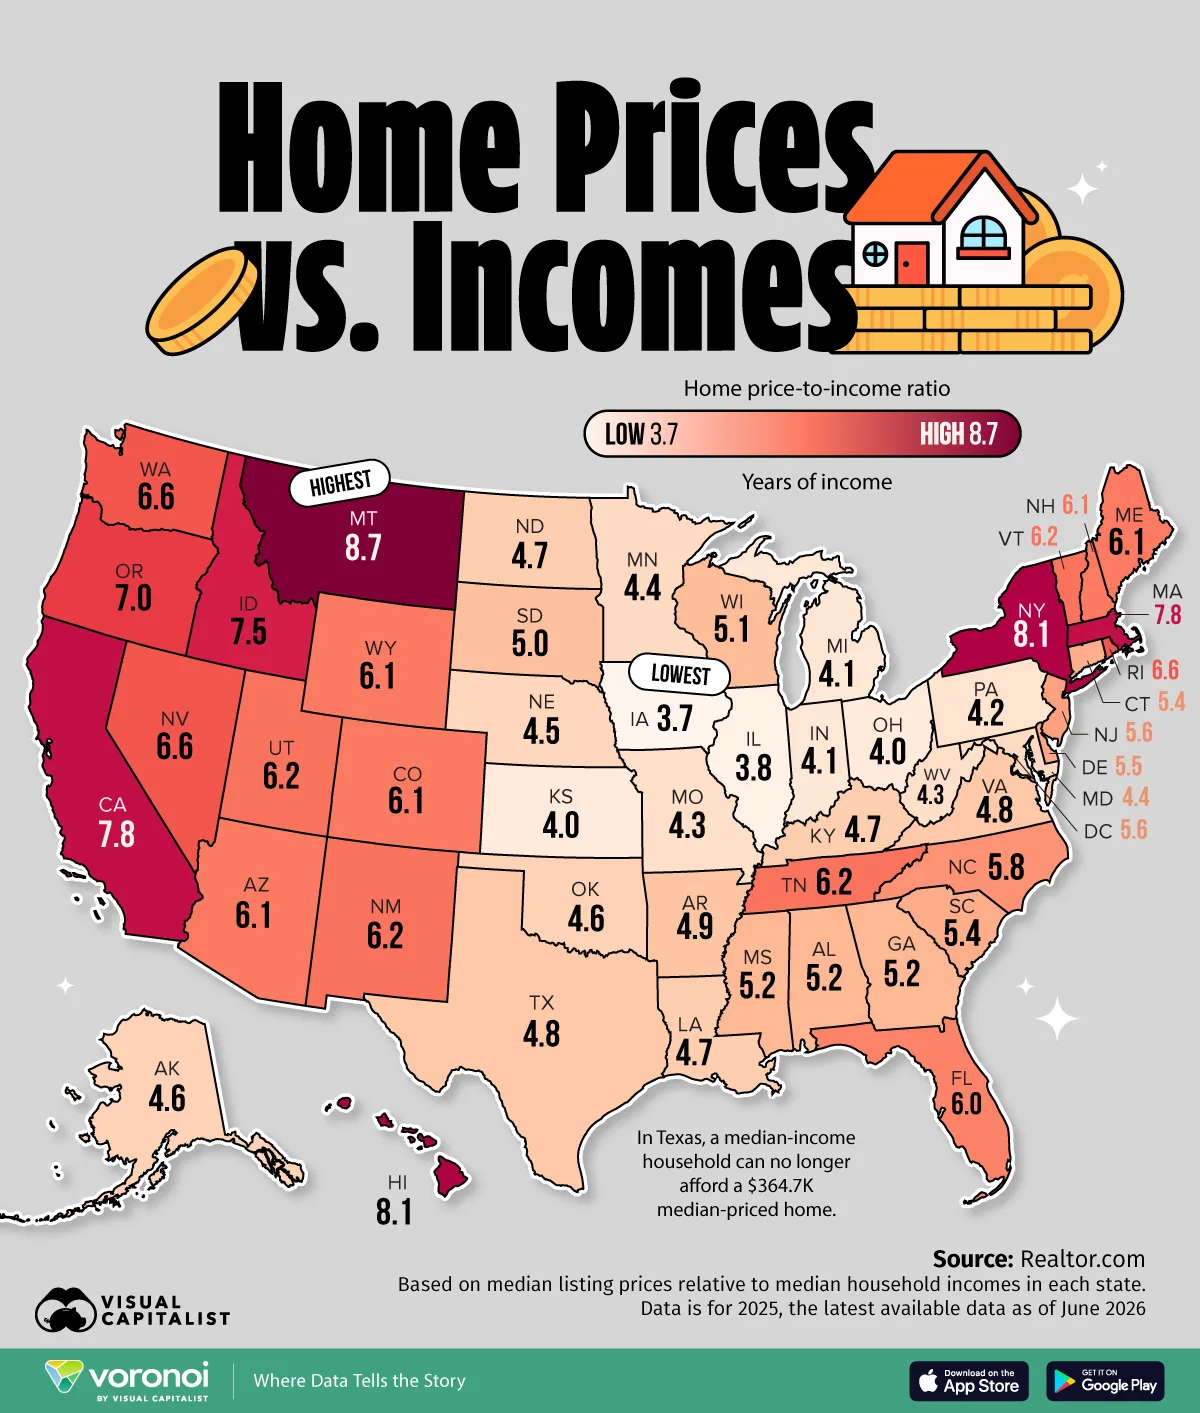
Mapped: How Many Years of Income to Buy a Home in Every State
See visuals like this from many other data creators on our Voronoi app. Download it for free on iOS or Android and discover incredible data-driven charts from a variety of trusted sources.
Key Takeaways
- Montana now has America’s highest home price-to-income ratio, surpassing California and New York.
- Several fast-growing migration destinations have become far less affordable over the past five years.
- Iowa remains the country’s most affordable housing market, requiring just 3.7 years of median household income to buy a typical home.
America’s housing affordability map looks very different than it did a decade ago.
Several states that drew new residents with relatively low home prices now rank among the country’s least affordable markets relative to local incomes.
Using median listing prices and median household incomes from Realtor.com, this map shows how many years of income it takes to buy a typical home in every state. The results reveal where home prices have pulled furthest ahead of local earning power.
Home Affordability by State in 2025
The table below shows median listing prices relative to median household incomes in each state, effectively showing how many years of income it takes to buy a home.
| State | Home Price-to-Income Ratio 2025 |
Median Listing Price | Median Household Income |
|---|---|---|---|
| Montana | 8.7 | $628.4K | $72.1K |
| Hawaii | 8.1 | $767.4K | $94.6K |
| New York | 8.1 | $668.2K | $82.7K |
| California | 7.8 | $742.3K | $95.1K |
| Massachusetts | 7.8 | $763.7K | $98.2K |
| Idaho | 7.5 | $580.8K | $77.6K |
| Oregon | 7.0 | $564.0K | $80.4K |
| Washington | 6.6 | $638.2K | $96.1K |
| Nevada | 6.6 | $491.9K | $74.8K |
| Rhode Island | 6.6 | $563.2K | $85.7K |
| New Mexico | 6.2 | $398.8K | $64.4K |
| Tennessee | 6.2 | $430.5K | $69.7K |
| Utah | 6.2 | $589.9K | $95.6K |
| Vermont | 6.2 | $504.6K | $81.9K |
| Arizona | 6.1 | $484.5K | $78.8K |
| Maine | 6.1 | $459.3K | $75.2K |
| Wyoming | 6.1 | $472.4K | $77.7K |
| Colorado | 6.1 | $579.4K | $95.5K |
| New Hampshire | 6.1 | $586.1K | $96.8K |
| Florida | 6.0 | $432.7K | $72.7K |
| North Carolina | 5.8 | $413.0K | $71.5K |
| New Jersey | 5.6 | $556.3K | $99.4K |
| District of Columbia | 5.6 | $589.7K | $106.0K |
| Delaware | 5.5 | $486.0K | $87.7K |
| Connecticut | 5.4 | $518.9K | $95.4K |
| South Carolina | 5.4 | $363.9K | $67.8K |
| Georgia | 5.2 | $392.1K | $75.1K |
| Mississippi | 5.2 | $294.5K | $56.8K |
| Alabama | 5.2 | $330.8K | $64.0K |
| Wisconsin | 5.1 | $388.1K | $75.7K |
| South Dakota | 5.0 | $379.5K | $75.7K |
| Arkansas | 4.9 | $299.8K | $60.7K |
| Virginia | 4.8 | $447.0K | $92.7K |
| Texas | 4.8 | $364.7K | $76.6K |
| Kentucky | 4.7 | $306.6K | $64.6K |
| Louisiana | 4.7 | $278.9K | $59.3K |
| North Dakota | 4.7 | $364.3K | $77.7K |
| Alaska | 4.6 | $436.4K | $94.2K |
| Oklahoma | 4.6 | $299.4K | $65.0K |
| Nebraska | 4.5 | $346.2K | $77.0K |
| Minnesota | 4.4 | $388.2K | $88.6K |
| Maryland | 4.4 | $434.3K | $99.3K |
| Missouri | 4.3 | $301.2K | $69.7K |
| West Virginia | 4.3 | $259.5K | $60.2K |
| Pennsylvania | 4.2 | $312.5K | $74.9K |
| Michigan | 4.1 | $290.3K | $70.1K |
| Indiana | 4.1 | $295.8K | $71.5K |
| Kansas | 4.0 | $292.6K | $74.0K |
| Ohio | 4.0 | $277.3K | $70.2K |
| Illinois | 3.8 | $307.7K | $80.6K |
| Iowa | 3.7 | $282.9K | $76.0K |
Why Montana Is Now Less Affordable Than California
A typical home in Montana costs 8.7 years of household income, surpassing California, New York, and Massachusetts. The result would have seemed unlikely a decade ago, when Montana was widely viewed as an affordable alternative to coastal markets.
Montana’s ranking illustrates how dramatically America’s housing market has shifted. Home prices surged during the pandemic-era migration boom, and between 2020 and 2025, the state’s population grew 5.9%, helping fuel demand in a market with limited housing supply.
Meanwhile, neighboring Idaho saw the third-fastest growth in net migration and now ranks among the 10 most unaffordable states relative to income.
The Affordable Sun Belt Is Getting Harder to Find
The shift isn’t limited to one state. Many Sun Belt markets that attracted millions of Americans with lower housing costs have become significantly less affordable as prices climbed faster than local incomes.
Now, a median-income household in Texas can no longer afford a median-priced home valued at $364,700. Promisingly, however, Texas and Florida are building more homes than any other state, holding a combined 27% of the nation’s building permits in 2025.
This highlights how fast affordability has deteriorated in some of America’s fastest-growing states. While these markets remain less expensive than California or New York, home prices have risen much faster than many buyers expected.
The Midwest Is Emerging as America’s Affordability Stronghold
While affordability has eroded across much of the country, the Midwest remains a notable exception.
Iowa ranks as the most affordable state in America, requiring just 3.7 years of household income to purchase a typical home, at about $283,000 in 2025. Nearby states including Ohio, Indiana, Illinois, and Kansas also rank among the country’s most attainable housing markets, where median home prices remain near or below $300,000.
Each of these states has a home price-to-income ratio close to what the median U.S. homebuyer faced in 2000.
America’s Housing Map Has Been Redrawn
A generation ago, Americans could often find more affordable housing by moving away from expensive coastal markets. Today, several of those destinations rank among the country’s least affordable places relative to local incomes.
The result is a new housing landscape where affordability is increasingly concentrated in a handful of Midwestern states, while much of the country’s growth corridors have become harder for local households to afford.
Learn More on the Voronoi App 
To learn more about this topic, check out this graphic showing where wealth is moving in America.