Mean vs. Median: Visualizing Net Worth in the U.S. by Age
See visuals like this from many other data creators on our Voronoi app. Download it for free on iOS or Android and discover incredible data-driven charts from a variety of trusted sources.
Key Takeaways
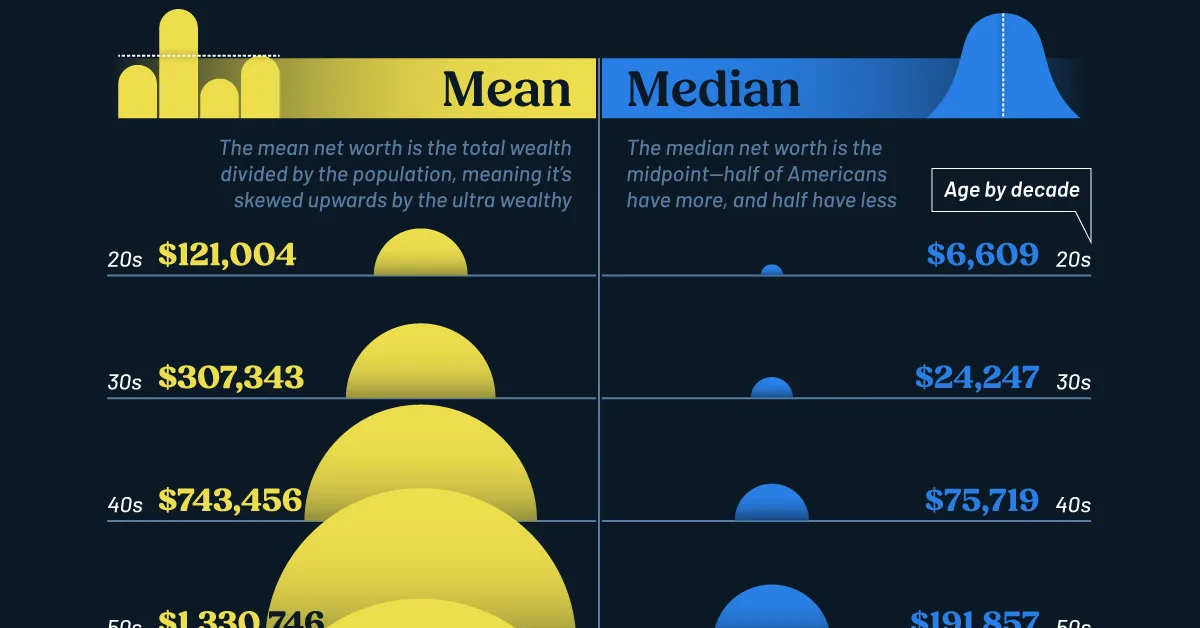
- Mean net worth is the average calculated by adding all net worth values and dividing by the number of households, making it sensitive to very wealthy outliers.
- Median net worth represents the middle value where half of households have more and half have less, giving a clearer view of the typical household’s financial position.
The relationship between age and wealth offers insight into how financial security builds over time. In this graphic, we compare the mean and median household net worth across age groups, showing how dramatically the two averages can differ.
Due to extreme wealth (e.g. the presence of billionaires), the mean average paints a more optimistic picture than what most households actually experience. As a result, looking at both averages side by side gives a more complete view of American wealth.
Data & Discussion
The data for this visualization comes from Empower. It compares the average net worth by age in America.
| Age by decade | Mean Average | Median Average |
|---|---|---|
| 20s | $121,004 | $6,609 |
| 30s | $307,343 | $24,247 |
| 40s | $743,456 | $75,719 |
| 50s | $1,330,746 | $191,857 |
| 60s | $1,547,378 | $290,447 |
| 70s | $1,444,413 | $233,085 |
| 80s | $1,342,656 | $233,436 |
| 90s | $1,212,583 | $205,043 |
How Net Worth is Calculated
Net worth is the total value of your assets minus your liabilities. Here’s a summary of what the Federal Reserve includes under each category.
Assets include:
 Cash within bank accounts
 Investment accounts and life insurance policies
 Retirement accounts, including IRAs and 401(k)s
 Value of real estate and vehicles
Meanwhile, liabilities include:
 Mortgages
- Home equity lines of credit or home equity loans
 Credit card balances
 Installment loans, including personal loans, auto loans, and student loans
The Difference Between Mean and Median
Across every age group in the dataset, the mean net worth is larger than the median. For example, Americans in their 40s have a mean net worth of $743,456, yet the median sits at just $75,719.
This is because the mean is calculated by adding up all of the values in a dataset and dividing the total by the number of entries. As a result, very wealthy households pull the overall numbers upward.
On the other hand, the median is calculated by ordering all values from lowest to highest, and then selecting the middle one. This can be interpreted as a more realistic measure because it ignores the influence of a small number of extremely wealthy households.
Learn More on the Voronoi App 
If you enjoyed today’s post, check out Countries With the Most High Net Worth Individuals on Voronoi, the new app from Visual Capitalist.
- Source: https://www.visualcapitalist.com/mean-vs-median-visualizing-net-worth-in-the-u-s-by-age-group/