


Payday Pulse: America’s Growing Mountain of Debt
Key Takeaways
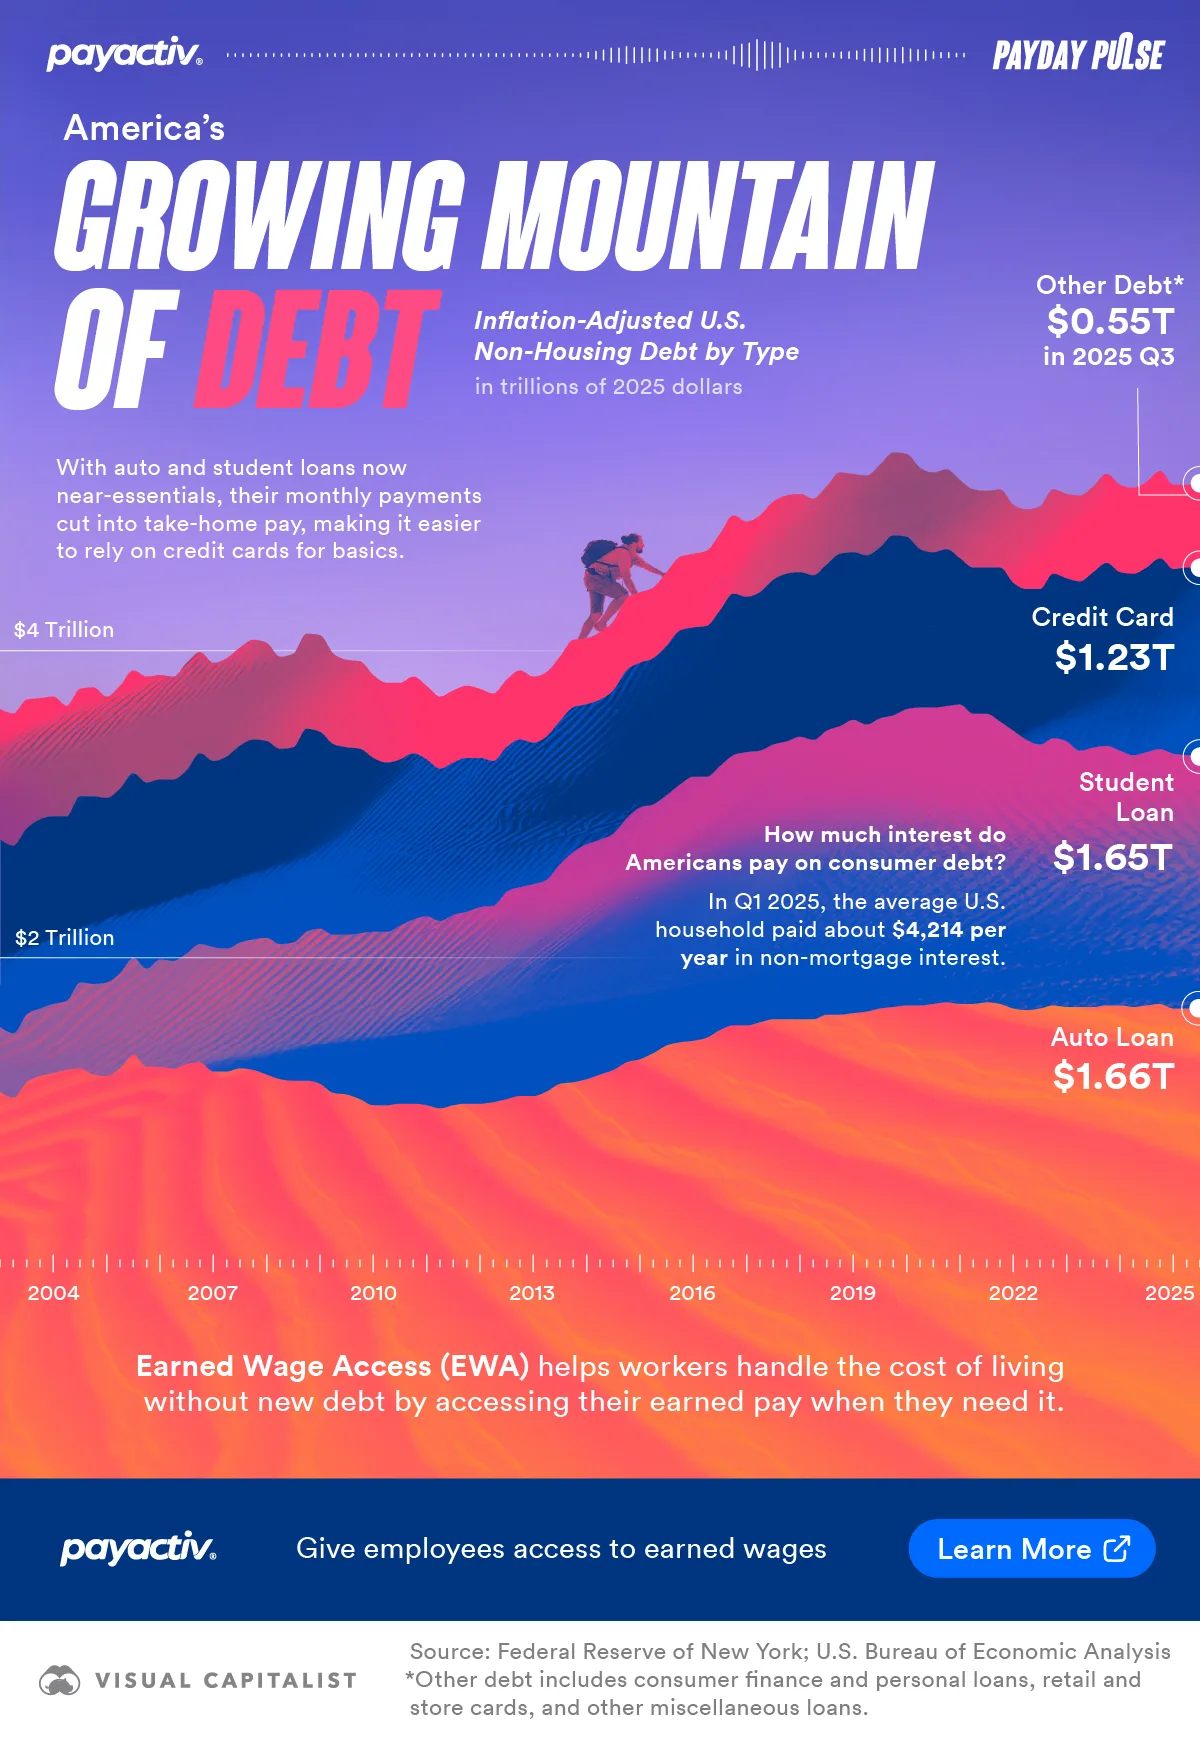
- Auto and student loans increasingly anchor America’s mountain of debt, tightening household cash flow.
- In Q1 2025, the average U.S. household paid about $4,214 per year in non-mortgage interest.
- Earned Wage Access can reduce reliance on interest-bearing options by unlocking already-earned wages earlier.
Higher everyday costs have made cash-flow timing more fragile for many households. As a result, more workers lean on borrowing to cover near-essentials and stay flexible.
This graphic, in partnership with Payactiv, shows America’s mountain of debt across major non-housing categories using data from the Federal Reserve Bank of New York.
The Mountain of Debt Has Shifted Beyond Housing
Here is a table that shows quarterly, inflation-adjusted debt levels from 2003 to 2025 in trillions of USD, split by category.
| Period | Auto Loans | Credit Card | Student Loan | Other |
|---|---|---|---|---|
| 03:Q1 | 1.13 | 1.22 | 0.42 | 0.85 |
| 03:Q2 | 1.09 | 1.22 | 0.42 | 0.86 |
| 03:Q3 | 1.19 | 1.21 | 0.44 | 0.84 |
| 03:Q4 | 1.23 | 1.23 | 0.44 | 0.79 |
| 04:Q1 | 1.25 | 1.22 | 0.45 | 0.78 |
| 04:Q2 | 1.27 | 1.20 | 0.45 | 0.72 |
| 04:Q3 | 1.28 | 1.21 | 0.56 | 0.70 |
| 04:Q4 | 1.24 | 1.22 | 0.59 | 0.71 |
| 05:Q1 | 1.23 | 1.20 | 0.61 | 0.66 |
| 05:Q2 | 1.28 | 1.20 | 0.62 | 0.67 |
| 05:Q3 | 1.37 | 1.20 | 0.63 | 0.67 |
| 05:Q4 | 1.29 | 1.21 | 0.64 | 0.69 |
| 06:Q1 | 1.29 | 1.17 | 0.70 | 0.68 |
| 06:Q2 | 1.28 | 1.18 | 0.70 | 0.67 |
| 06:Q3 | 1.31 | 1.19 | 0.72 | 0.70 |
| 06:Q4 | 1.32 | 1.24 | 0.77 | 0.66 |
| 07:Q1 | 1.26 | 1.21 | 0.81 | 0.64 |
| 07:Q2 | 1.26 | 1.25 | 0.80 | 0.64 |
| 07:Q3 | 1.28 | 1.28 | 0.82 | 0.64 |
| 07:Q4 | 1.27 | 1.30 | 0.85 | 0.65 |
| 08:Q1 | 1.24 | 1.28 | 0.89 | 0.64 |
| 08:Q2 | 1.21 | 1.27 | 0.88 | 0.60 |
| 08:Q3 | 1.20 | 1.27 | 0.90 | 0.61 |
| 08:Q4 | 1.20 | 1.32 | 0.97 | 0.62 |
| 09:Q1 | 1.18 | 1.28 | 1.01 | 0.63 |
| 09:Q2 | 1.12 | 1.24 | 1.03 | 0.59 |
| 09:Q3 | 1.11 | 1.22 | 1.04 | 0.57 |
| 09:Q4 | 1.08 | 1.20 | 1.08 | 0.57 |
| 10:Q1 | 1.04 | 1.13 | 1.13 | 0.54 |
| 10:Q2 | 1.04 | 1.10 | 1.13 | 0.52 |
| 10:Q3 | 1.05 | 1.08 | 1.16 | 0.50 |
| 10:Q4 | 1.05 | 1.08 | 1.20 | 0.50 |
| 11:Q1 | 1.04 | 1.02 | 1.23 | 0.48 |
| 11:Q2 | 1.02 | 0.99 | 1.22 | 0.47 |
| 11:Q3 | 1.04 | 0.99 | 1.24 | 0.47 |
| 11:Q4 | 1.05 | 1.00 | 1.25 | 0.47 |
| 12:Q1 | 1.05 | 0.97 | 1.28 | 0.45 |
| 12:Q2 | 1.06 | 0.94 | 1.28 | 0.44 |
| 12:Q3 | 1.08 | 0.94 | 1.35 | 0.44 |
| 12:Q4 | 1.10 | 0.96 | 1.36 | 0.45 |
| 13:Q1 | 1.10 | 0.92 | 1.38 | 0.43 |
| 13:Q2 | 1.13 | 0.93 | 1.38 | 0.42 |
| 13:Q3 | 1.18 | 0.93 | 1.43 | 0.42 |
| 13:Q4 | 1.19 | 0.94 | 1.50 | 0.44 |
| 14:Q1 | 1.21 | 0.91 | 1.53 | 0.43 |
| 14:Q2 | 1.24 | 0.91 | 1.53 | 0.44 |
| 14:Q3 | 1.27 | 0.93 | 1.54 | 0.45 |
| 14:Q4 | 1.32 | 0.96 | 1.59 | 0.47 |
| 15:Q1 | 1.34 | 0.94 | 1.64 | 0.46 |
| 15:Q2 | 1.38 | 0.95 | 1.62 | 0.46 |
| 15:Q3 | 1.43 | 0.97 | 1.63 | 0.48 |
| 15:Q4 | 1.45 | 1.00 | 1.68 | 0.48 |
| 16:Q1 | 1.46 | 0.97 | 1.72 | 0.48 |
| 16:Q2 | 1.48 | 0.98 | 1.70 | 0.49 |
| 16:Q3 | 1.53 | 1.01 | 1.72 | 0.50 |
| 16:Q4 | 1.56 | 1.05 | 1.76 | 0.51 |
| 17:Q1 | 1.56 | 1.01 | 1.78 | 0.49 |
| 17:Q2 | 1.58 | 1.03 | 1.77 | 0.50 |
| 17:Q3 | 1.60 | 1.07 | 1.79 | 0.51 |
| 17:Q4 | 1.60 | 1.09 | 1.81 | 0.51 |
| 18:Q1 | 1.60 | 1.07 | 1.84 | 0.51 |
| 18:Q2 | 1.60 | 1.07 | 1.82 | 0.50 |
| 18:Q3 | 1.63 | 1.08 | 1.85 | 0.51 |
| 18:Q4 | 1.63 | 1.12 | 1.88 | 0.53 |
| 19:Q1 | 1.64 | 1.09 | 1.91 | 0.51 |
| 19:Q2 | 1.65 | 1.10 | 1.87 | 0.52 |
| 19:Q3 | 1.67 | 1.11 | 1.89 | 0.54 |
| 19:Q4 | 1.68 | 1.17 | 1.90 | 0.54 |
| 20:Q1 | 1.69 | 1.12 | 1.93 | 0.54 |
| 20:Q2 | 1.69 | 1.03 | 1.94 | 0.53 |
| 20:Q3 | 1.70 | 1.01 | 1.93 | 0.52 |
| 20:Q4 | 1.71 | 1.02 | 1.93 | 0.52 |
| 21:Q1 | 1.70 | 0.95 | 1.95 | 0.51 |
| 21:Q2 | 1.70 | 0.95 | 1.89 | 0.51 |
| 21:Q3 | 1.71 | 0.95 | 1.88 | 0.50 |
| 21:Q4 | 1.70 | 1.00 | 1.84 | 0.51 |
| 22:Q1 | 1.67 | 0.96 | 1.81 | 0.51 |
| 22:Q2 | 1.66 | 0.98 | 1.76 | 0.52 |
| 22:Q3 | 1.67 | 1.01 | 1.72 | 0.54 |
| 22:Q4 | 1.69 | 1.07 | 1.74 | 0.55 |
| 23:Q1 | 1.68 | 1.06 | 1.73 | 0.55 |
| 23:Q2 | 1.68 | 1.10 | 1.67 | 0.56 |
| 23:Q3 | 1.68 | 1.14 | 1.69 | 0.56 |
| 23:Q4 | 1.69 | 1.19 | 1.69 | 0.58 |
| 24:Q1 | 1.69 | 1.16 | 1.66 | 0.57 |
| 24:Q2 | 1.68 | 1.18 | 1.64 | 0.56 |
| 24:Q3 | 1.69 | 1.20 | 1.65 | 0.56 |
| 24:Q4 | 1.70 | 1.24 | 1.66 | 0.57 |
| 25:Q1 | 1.67 | 1.20 | 1.66 | 0.55 |
| 25:Q2 | 1.67 | 1.22 | 1.65 | 0.54 |
| 25:Q3 | 1.66 | 1.23 | 1.65 | 0.55 |
Even after adjusting for inflation, non-housing balances rise across cycles in the dataset. Still, the dip around 2010 reflects defaults and paydowns after the subprime mortgage crisis.
Since then, balances have been rebuilt, and higher rates can magnify interest costs.
Rising consumer debt inevitably leads to higher interest payments. In Q1 2025, the average U.S. household paid about $4,214 per year in non-mortgage interest.
Auto and Student Loans Act Like Near-Essentials
Auto and student loans often fund commuting and credentials, so households treat them as near-essentials. However, these categories now drive much of the rise highlighted in the graphic.
In Q3 2025, student loans stood at about $1.65T, auto loans at about $1.66T, and credit cards at about $1.23T. For those with the deepest debt relative to their income, interest charges can crowd out savings and emergency funds.
Credit cards often fill short gaps when budgets tighten. Consequently, workers may prioritize minimum payments and delay building buffers.
Using Earned Wages Earlier, Without New Debt
Debt can support big goals, yet short timing gaps can push workers into avoidable interest or fees. Because paychecks arrive later than bills, even small mismatches can snowball.
Earned Wage Access (EWA) lets employees access already-earned wages earlier through an employer-connected payroll flow.

-

 Cost of Living12 hours ago
Payday Pulse: Where Americans Are Most Burdened by Household Debt
Household debt loads vary by metro, with several areas above a 2.5 DTI ratio. This graphic maps where pressure is highest and why pay timing matters.
-

 Jobs12 hours ago
Payday Pulse: 5,000 Years of Wages In One Giant Timeline
A 5,000-year look at how wages moved from rations and coins to paychecks and modern earned wage access.
-
 Jobs3 months ago
Explainer: What is Earned Wage Access and Why Do You Need it?
Earned wage access vs estimated advances: find out how verified, employer-sponsored access avoids debt and improves retention.


var disqus_shortname = “visualcapitalist.disqus.com”;
var disqus_title = “Payday Pulse: America’s Growing Mountain of Debt”;
var disqus_url = “https://www.visualcapitalist.com/sp/pay01-payday-pulse-americas-growing-mountain-of-debt/”;
var disqus_identifier = “visualcapitalist.disqus.com-193383”;