Which Major U.S. Cities Are the Reddest and Bluest?
Key Takeaways:
- Washington, D.C. is the bluest major U.S. city by this measure, with 90.3% of votes cast for the Democratic presidential candidate in 2024.
- Lubbock, Texas ranks as the reddest, with Lubbock County giving 69.2% of votes to the Republican candidate.
- California appears on both sides of the ranking, highlighting substantial political variation within individual states.
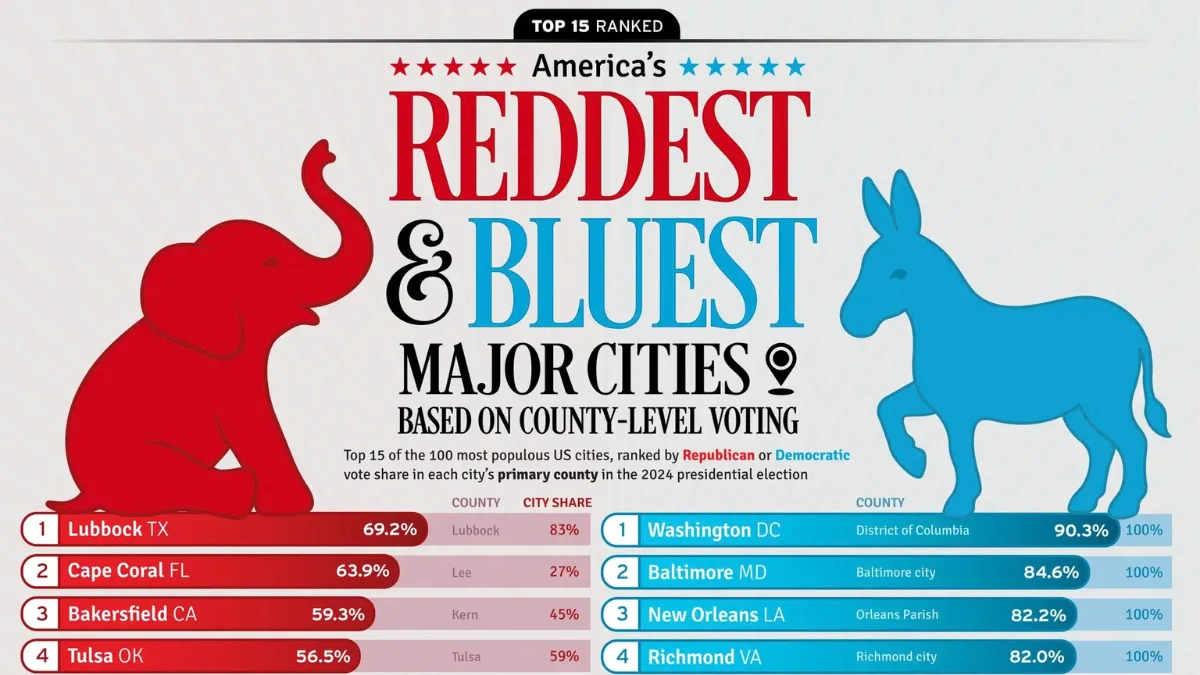
This graphic, created by Julie R. Peasley, ranks cities among the 100 largest in the U.S. by 2024 population according to the Republican or Democratic presidential vote share in each city’s primary county.
Population data comes from the U.S. Census Bureau, while election results primarily come from the MIT Election Data and Science Lab.
America’s Reddest and Bluest Major Cities
The table below shows the 15 most Democratic major cities.
| Rank | City | Primary County | Democratic % | City Share of County Population |
|---|---|---|---|---|
| 1 | Washington, DC | District of Columbia | 90.3% | 100% |
| 2 | Baltimore, MD | Baltimore city | 84.6% | 100% |
| 3 | New Orleans, LA | Orleans Parish | 82.2% | 100% |
| 4 | Richmond, VA | Richmond city | 82.0% | 100% |
| 5 | St. Louis, MO | St. Louis city | 81.2% | 100% |
| 6 | San Francisco, CA | San Francisco County | 80.3% | 100% |
| 7 | Durham, NC | Durham County | 79.8% | 88% |
| 8 | Philadelphia, PA | Philadelphia County | 78.8% | 100% |
| 9 | Portland, OR | Multnomah County | 78.7% | 80% |
| 10 | Denver, CO | Denver County | 76.7% | 100% |
| 11 | Madison, WI | Dane County | 74.9% | 49% |
| 12 | Oakland, CA | Alameda County | 74.6% | 27% |
| 13 | Boston, MA | Suffolk County | 74.3% | 85% |
| 14 | Seattle, WA | King County | 73.6% | 33% |
| 15 | Atlanta, GA | Fulton County | 71.9% | 44% |
And here are the 15 most Republican major cities:
| Rank | City | Primary County | Republican % | City Share of County Population |
|---|---|---|---|---|
| 1 | Lubbock, TX | Lubbock County | 69.2% | 83% |
| 2 | Cape Coral, FL | Lee County | 63.9% | 27% |
| 3 | Bakersfield, CA | Kern County | 59.3% | 45% |
| 4 | Tulsa, OK | Tulsa County | 56.5% | 59% |
| 5 | Wichita, KS | Sedgwick County | 56.1% | 75% |
| 6 | Miami, FL | Miami-Dade County | 55.4% | 17% |
| 7 | Fort Wayne, IN | Allen County | 55.3% | 68% |
| 8 | Corpus Christi, TX | Nueces County | 55.2% | 90% |
| 9 | Frisco/McKinney/Plano, TX | Collin County | 54.2% | 52% |
| 10 | Port St. Lucie, FL | St. Lucie County | 54.2% | 66% |
| 11 | Boise, ID | Ada County | 53.8% | 44% |
| 12 | Colorado Springs, CO | El Paso County | 53.6% | 66% |
| 13 | Huntsville, AL | Madison County | 53.4% | 53% |
| 14 | St. Petersburg, FL | Pinellas County | 52.1% | 28% |
| 15 | Fort Worth/Arlington, TX | Tarrant County | 51.8% | 62% |
Washington, D.C. leads the blue side at 90.3%, followed by Baltimore at 84.6%. On the red side, Lubbock leads at 69.2%, followed by Cape Coral at 63.9% and Bakersfield at 59.3%.
One important caveat is that these are county-level election results, not city-level results. While Washington, Baltimore, Philadelphia, and Denver account for their entire county or county-equivalent, Oakland represents just 27% of Alameda County’s population and St. Petersburg 28% of Pinellas County.
The Red-Blue Divide Goes Beyond State Lines
The rankings show why broad state-level labels can obscure substantial local variation. California is a clear example: San Francisco and Oakland appear among the bluest major cities in the ranking, while Bakersfield lands on the red side, with Kern County voting 59.3% Republican.
Florida shows a different pattern. Cape Coral, Miami, Port St. Lucie, and St. Petersburg all appear among the 15 reddest major cities by this measure. Together, the results show how political geography can vary considerably within states and why county-level results can reveal patterns that statewide results do not.
Geography is only one way to examine America’s political divide. Age is another, with notable differences in political affiliation by generation in the U.S.
Learn More on the Voronoi App
To explore another angle on the 2024 election, see How Americans Voted Based on Their View of the Economy on the Voronoi app.