Ranked: Canada’s Biggest Export Partners
Key Takeaways
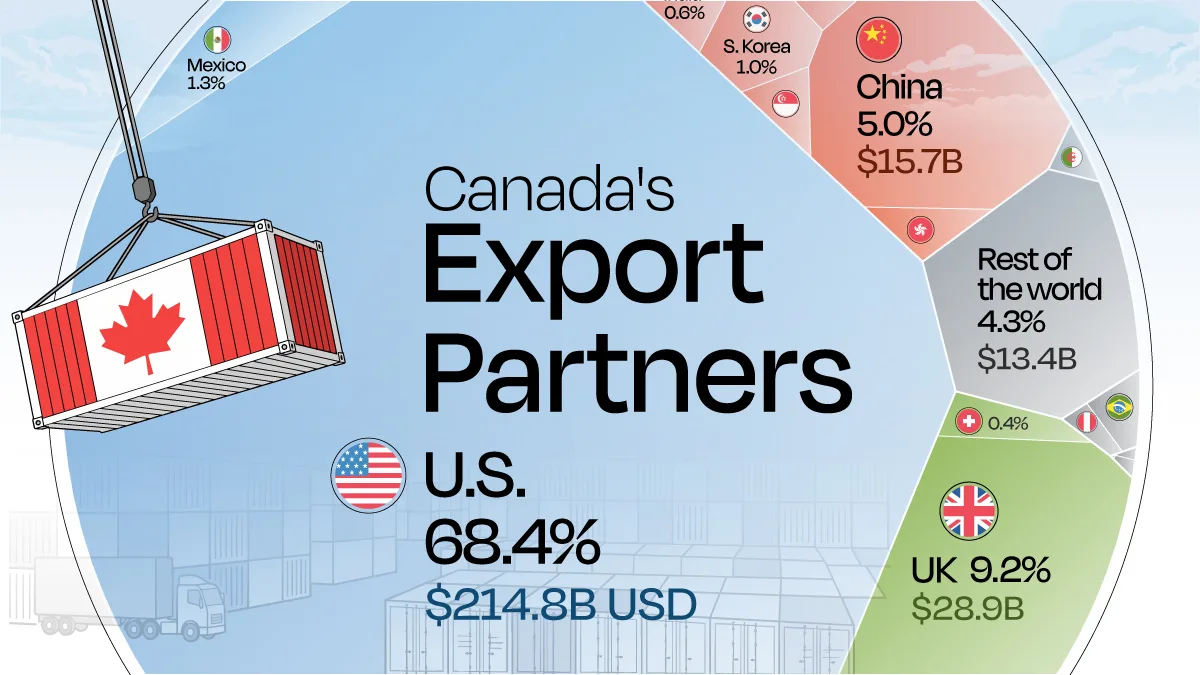
- Canada sent $214.8 billion (C$298.2 billion) in goods to the U.S. in H1 2026, equal to 68% of its total merchandise exports.
- The UK ranked second at 9.2%, though its total was heavily influenced by precious metals transactions. China followed at 5.0%.
- The 50% tariffs in effect cover roughly 5% of Canada’s U.S.-bound exports, yet BMO estimates they could cut half a percentage point from GDP growth.
Canada sends more than two-thirds of its merchandise exports to the United States, making the U.S. market central to the country’s trade economy. That concentration has taken on greater significance as tariffs and trade negotiations reshape the relationship between the two countries.
This graphic uses Statistics Canada international merchandise trade data to visualize Canada’s export destinations in the first half of 2026.
Figures are measured on a balance of payments basis, seasonally adjusted, and converted to U.S. dollars at the August 25, 2026 exchange rate (1 USD = 1.3884 CAD).
Canada’s Exports by Country in H1 2026
Canada exported $313.9 billion (C$435.9 billion) in goods between January and June 2026.
The data table below breaks down Canada’s exports by country, in both Canadian and U.S. dollars, along with each country’s share of Canadian exports in H1 2026:
| Rank | Country | Exports in H1 2026 (CAD, billions) |
Exports in H1 2026 (USD, billions) |
Share of Canadian Exports |
|---|---|---|---|---|
| 1 |  United States United States |
298.2 | 214.8 | 68.42% |
| 2 |  United Kingdom United Kingdom |
40.1 | 28.9 | 9.21% |
| 3 |  China China |
21.8 | 15.7 | 5.01% |
| 4 |  Japan Japan |
6.7 | 4.8 | 1.53% |
| 5 |  Mexico Mexico |
5.5 | 3.9 | 1.25% |
| 6 |  Netherlands Netherlands |
5.4 | 3.9 | 1.24% |
| 7 |  Germany Germany |
4.9 | 3.5 | 1.12% |
| 8 |  Rest of EU Rest of EU |
4.6 | 3.3 | 1.06% |
| 9 |  South Korea South Korea |
4.2 | 3.0 | 0.96% |
| 10 |  France France |
3.3 | 2.3 | 0.75% |
| 11 |  India India |
2.4 | 1.7 | 0.56% |
| 12 |  Australia Australia |
2.4 | 1.7 | 0.55% |
| 13 |  Italy Italy |
2.1 | 1.5 | 0.49% |
| 14 |  Indonesia Indonesia |
1.9 | 1.4 | 0.43% |
| 15 |  Belgium Belgium |
1.7 | 1.2 | 0.39% |
| 16 |  Hong Kong Hong Kong |
1.6 | 1.2 | 0.38% |
| 17 |  Brazil Brazil |
1.6 | 1.2 | 0.38% |
| 18 |  Switzerland Switzerland |
1.6 | 1.2 | 0.37% |
| 19 |  Singapore Singapore |
1.5 | 1.1 | 0.34% |
| 20 |  Norway Norway |
1.3 | 1 | 0.30% |
| 21 |  Spain Spain |
1.1 | 0.8 | 0.24% |
| 22 |  Taiwan Taiwan |
0.8 | 0.6 | 0.19% |
| 23 |  Peru Peru |
0.8 | 0.6 | 0.18% |
| 24 |  Algeria Algeria |
0.7 | 0.5 | 0.16% |
| 25 |  Türkiye Türkiye |
0.6 | 0.4 | 0.13% |
| 26 |  Saudi Arabia Saudi Arabia |
0.4 | 0.3 | 0.08% |
| 27 |  Iraq Iraq |
0 | 0 | 0.01% |
| 28 |  Russia Russia |
0 | 0 | 0.00% |
| — |  ROW ROW |
18.6 | 13.4 | 4.26% |
| — |  Total Exports Total Exports |
435.9 | 313.9 | 100.0% |
Geography and decades of integrated supply chains help explain the concentration. Canadian energy, manufacturing, and agricultural industries have developed around access to the massive U.S. market across a 5,525-mile (8,900-kilometer) shared border.
Beyond the UK, the European Union accounted for 5.3% of Canadian exports, while China accounted for 5.0%.
Japan, Mexico, and South Korea followed at 1.5%, 1.2%, and under 1%, respectively. Together, those five markets received $45.8 billion (C$63.6 billion) over six months, roughly 21 cents for every dollar shipped to the U.S.
The United Kingdom Number Needs a Caveat
The dataset places the United Kingdom second overall at 9.2%, or $28.9 billion (C$40.1 billion).
Statistics Canada notes that the UK figure includes significant precious metals transactions, a pattern confirmed by Global Affairs Canada’s State of Trade 2025 report, which identifies gold exports as the primary driver of Canada’s UK shipment growth.
This helps explain why the UK’s 9.2% share is so high relative to Canada’s broader trade relationship with the country. Excluding precious metals, the EU and China are larger destinations for Canadian exports.
Why Tariffs Matter Despite Covering Just 5% of Exports
Canada-U.S. trade negotiations broke down in August 2026, with 50% tariffs now in effect on a range of Canadian goods. Canada’s reliance on a single dominant export market limits how quickly affected trade can be redirected elsewhere.
The new duties cover roughly C$28 billion worth of Canadian exports, about 5% of what Canada ships to the U.S. annually, according to BMO senior economist Robert Kavcic. BMO estimates the tariffs could cut half a percentage point from Canada’s GDP growth.
That estimate highlights the broader risk of trade concentration. The EU and China each absorb only about 5% of Canadian exports, meaning even substantial growth in those markets would replace only a fraction of the volume currently sent south.
Canada is the largest export partner of 25 states, so the trade exposure runs both ways. However, with more than two-thirds of Canadian exports destined for the U.S., Canada has considerably more at stake in any disruption to cross-border trade.
Learn More on the Voronoi App
If you enjoyed this visualization, check out Charted: The United States Dominates Canada’s Trade on the Voronoi app.