Ranked: China’s Largest Trading Partners in 2025
See visuals like this from many other data creators on our Voronoi app. Download it for free on iOS or Android and discover incredible data-driven charts from a variety of trusted sources.
Key Takeaways
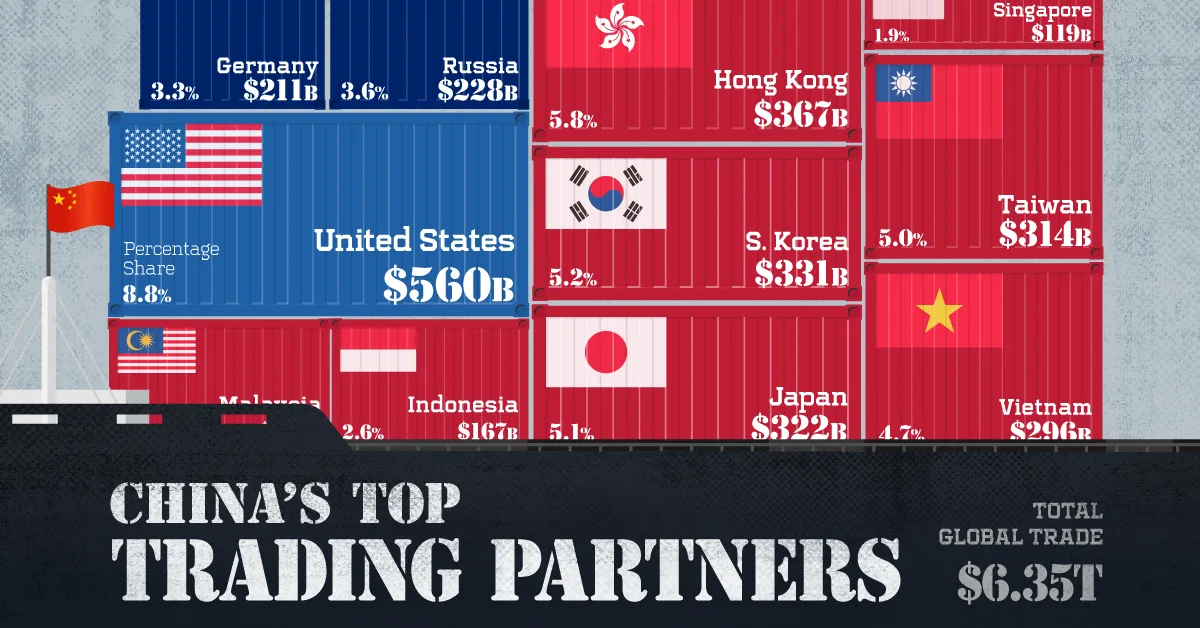
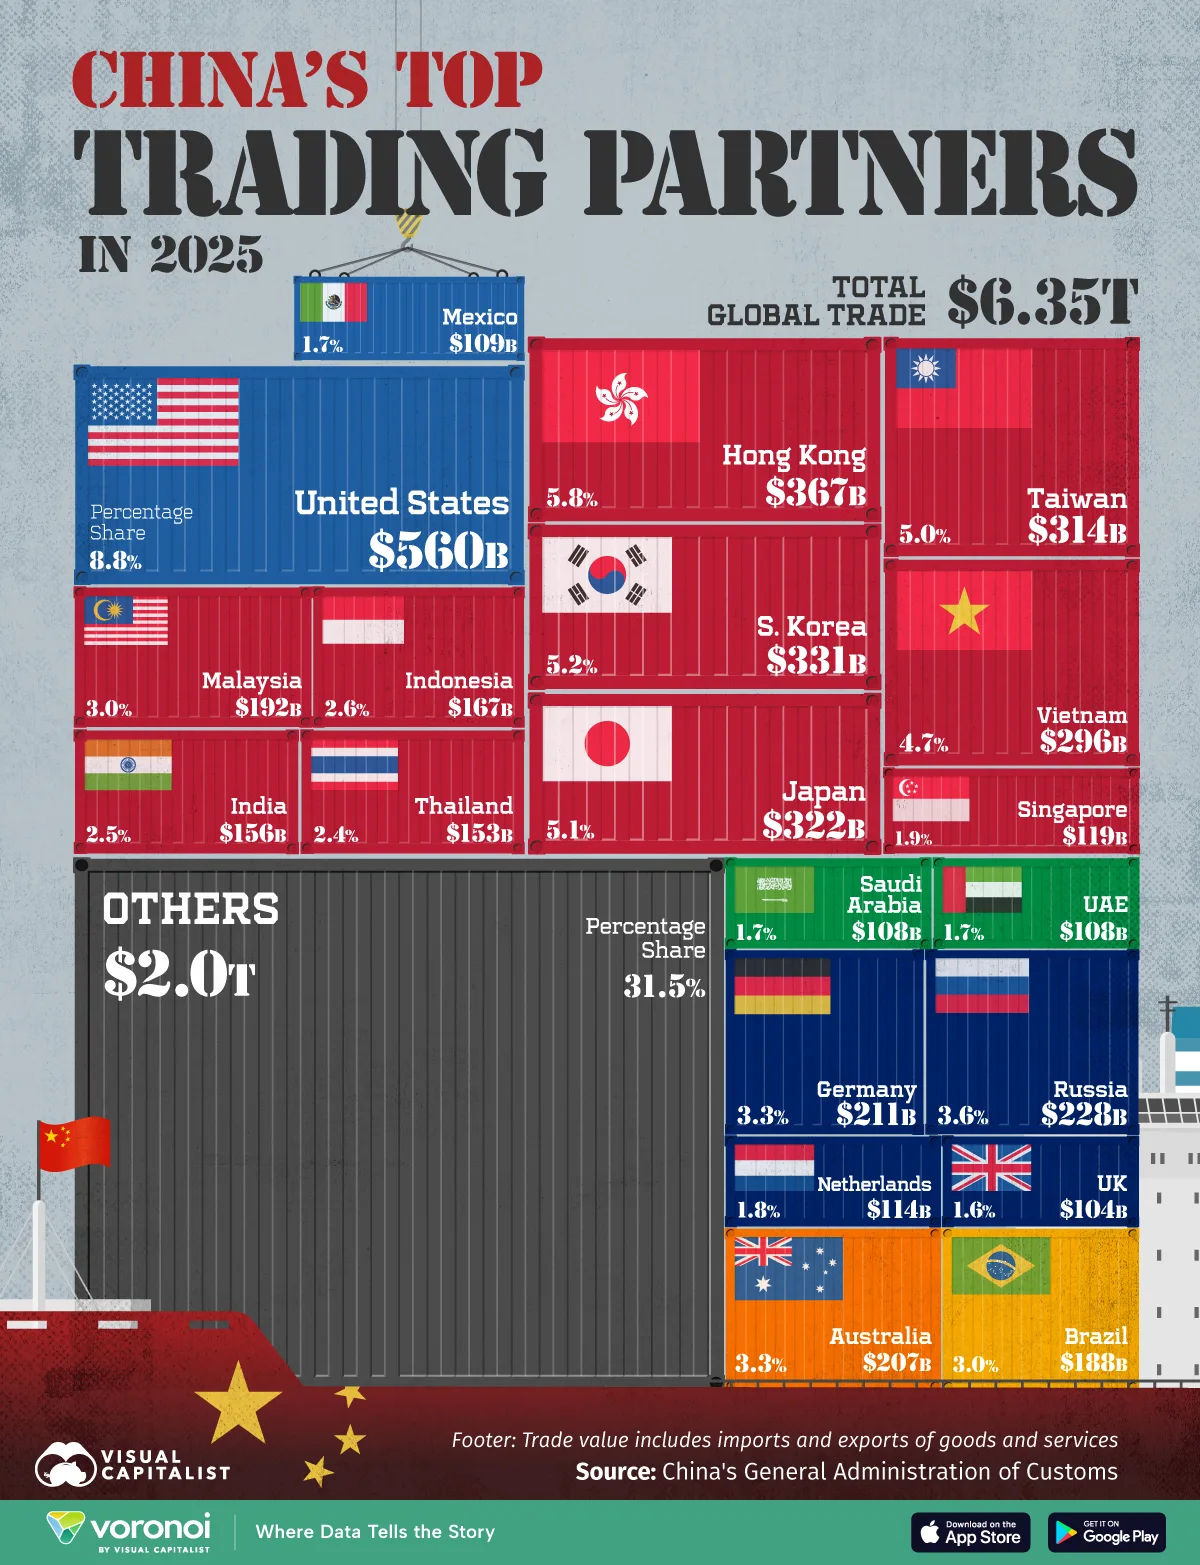
- The U.S. remained China’s largest trading partner in 2025, with $560 billion in trade.
- China’s total trade surpassed $6.3 trillion, generating a record $1.2 trillion surplus.
- Trade growth accelerated across Southeast Asia, while German car exports to China have fallen sharply since 2022.
China’s trade engine continues to expand, but the geography of that growth is shifting.
In 2025, total trade exceeded $6.3 trillion, driving a record $1.2 trillion surplus as exports outpaced relatively flat imports. While the U.S. remained China’s largest trading partner, trade momentum increasingly tilted toward Southeast Asia.
At the same time, strains are emerging in Europe. German car exports to China have dropped 66% since 2022, reflecting intensifying competition in the world’s largest auto market.
This graphic shows the country’s largest trading partners in 2025, based on data from China’s General Administration of Customs.
The U.S. Remains China’s Largest Trading Partner
At $560 billion in total trade, the U.S. accounted for 8.8% of China’s global trade in 2025. However, bilateral trade declined 18.7% year over year amid escalating tariff tensions.
| Rank | Country | Trade Value 2025 |
Share 2025 |
Change 2024-2025 |
|---|---|---|---|---|
| 1 |  U.S. U.S. |
$560B | 8.8% | -18.7% |
| 2 |  Hong Kong SAR Hong Kong SAR |
$367B | 5.8% | 18.9% |
| 3 |  South Korea South Korea |
$331B | 5.2% | 1.2% |
| 4 |  Japan Japan |
$322B | 5.1% | 4.5% |
| 5 |  Taiwan Taiwan |
$314B | 5.0% | 7.3% |
| 6 |  Vietnam Vietnam |
$296B | 4.7% | 13.7% |
| 7 |  Russia Russia |
$228B | 3.6% | -6.9% |
| 8 |  Germany Germany |
$211B | 3.3% | 4.6% |
| 9 |  Australia Australia |
$207B | 3.3% | -2.3% |
| 10 |  Malaysia Malaysia |
$192B | 3.0% | -9.6% |
| 11 |  Brazil Brazil |
$188B | 3.0% | -0.1% |
| 12 |  Indonesia Indonesia |
$167B | 2.6% | 13.4% |
| 13 |  India India |
$156B | 2.4% | 12.4% |
| 14 |  Thailand Thailand |
$153B | 2.4% | 14.4% |
| 15 |  Singapore Singapore |
$119B | 1.9% | 7.5% |
| 16 |  Netherlands Netherlands |
$114B | 1.8% | 3.9% |
| 17 |  Mexico Mexico |
$109B | 1.7% | 0.0% |
| 18 |  Saudi Arabia Saudi Arabia |
$108B | 1.7% | 0.5% |
| 19 |  UAE UAE |
$108B | 1.7% | 6.0% |
| 20 |  UK UK |
$104B | 1.6% | 5.3% |
Hong Kong ranked second at $367 billion, followed by South Korea, Japan, and Taiwan—all of which saw modest trade growth.
Meanwhile, Vietnam posted a 13.7% increase in bilateral trade, part of a broader surge in trade across the ASEAN region. Chinese exports to Africa also rose 25.8% year over year.
Europe’s Auto Weakness Stands Out
China-Germany trade reached $211 billion in 2025, up 4.6% overall. However, German exports to China fell 9.3% during the year.
Much of that decline reflects weakness in autos. Since 2022, German car exports to China have fallen 66%, raising pressure on manufacturers as domestic Chinese brands gain share.
India ranked 12th overall with $156 billion in trade, posting double-digit growth alongside Indonesia, Vietnam, and Thailand.
Learn More on the Voronoi App 
To learn more about this topic, check out this graphic on the top import partner of each U.S. state.