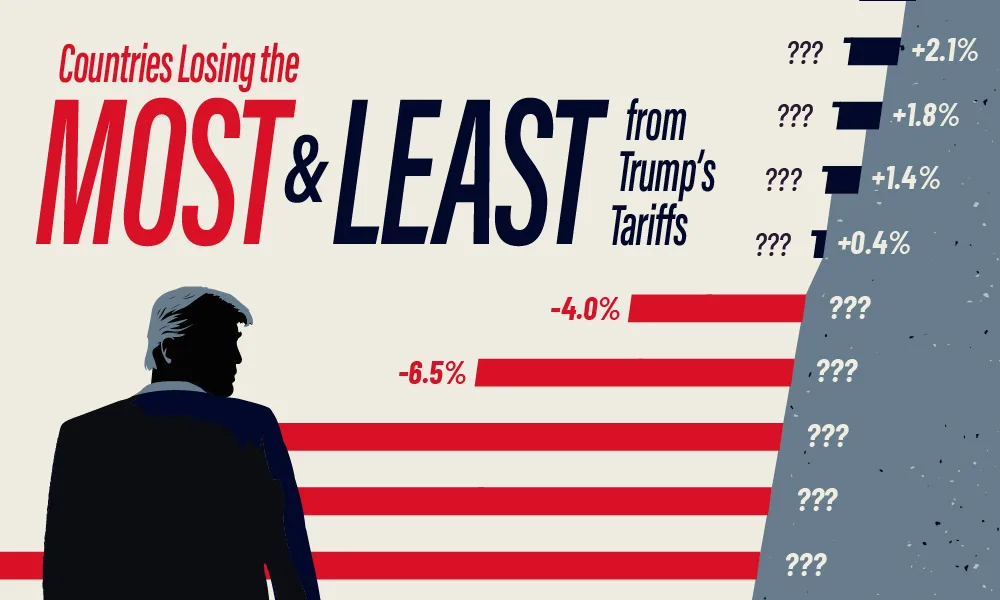
Ranked: Countries Losing the Most (and Least) from Trump’s Tariffs
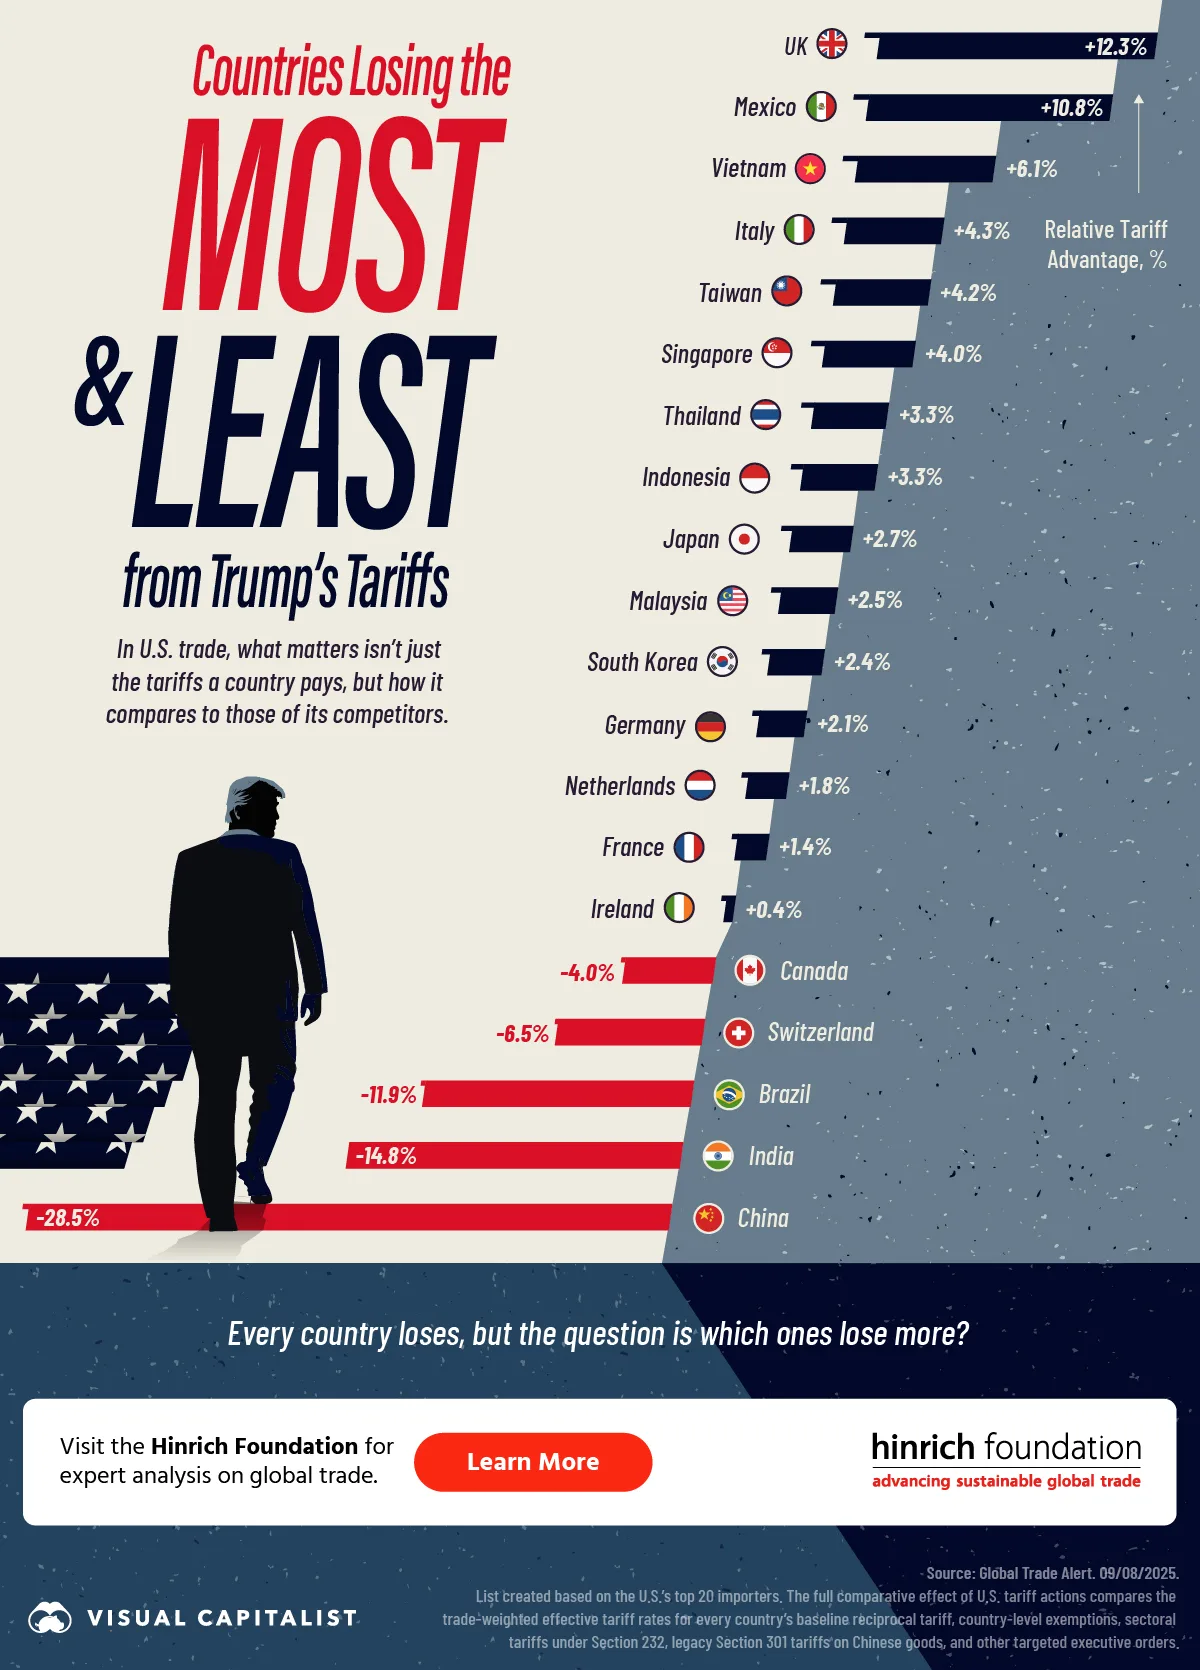
Trump’s tariffs are hitting all of America’s major trading partners. But in U.S. trade, what matters isn’t just the tariffs a country faces—it’s how they stack up against competitors.
This visualization, made with the Hinrich Foundation, shows which countries are losing the most, and the least, from Trump’s tariffs.
The data seen here is sourced from Global Trade Alert and is calculated by comparing a jurisdiction’s own trade-weighted tariff rate against the average rate faced by its competitors on the exact same products.
Tariffs on America’s Top 20 Importing Countries
When Trump took office in January 2025, he quickly hit America’s top trading partners with steep tariffs. The rates, however, varied widely by country.
China and India took the hardest hit, as trade-weighted tariff rates climbed to 47.3% and 38.0% by September 2025. Brazil (29.6%) and Switzerland (19.3%) also faced steep rates.
By contrast, Ireland (6.6%) and the UK (7.1%) saw much milder tariffs, while Canada (19.4%) and Germany (18.8%) landed in the middle.
Which Countries Have a Relative “Trump Tariff Advantage”?
Global Trade Alert compared tariff rates across competitors to rank which countries gained or lost ground. The final result is an estimate of relative tariff advantages (positive figures) and disadvantages (negative figures).
With China, India, and Brazil facing the steepest hikes, this gave their rivals a relative edge. Fourteen of the top 20 countries ended up with advantages. Leading the pack were the UK (+12.3%), Mexico (+10.8%), and Vietnam (+6.1%).
| Country | Relative Tariff Advantage (%) |
|---|---|
 UK UK |
12.3 |
 Mexico Mexico |
10.8 |
 Vietnam Vietnam |
6.1 |
 Italy Italy |
4.3 |
 Taiwan Taiwan |
4.2 |
 Singapore Singapore |
4.0 |
 Thailand Thailand |
3.3 |
 Indonesia Indonesia |
3.3 |
 Japan Japan |
2.7 |
 Malaysia Malaysia |
2.5 |
 South Korea South Korea |
2.4 |
 Germany Germany |
2.1 |
 Netherlands Netherlands |
1.8 |
 France France |
1.4 |
 Ireland Ireland |
0.4 |
 Canada Canada |
-4.0 |
 Switzerland Switzerland |
-6.5 |
 Brazil Brazil |
-11.9 |
 India India |
-14.8 |
 China China |
-28.5 |
On the losing side, China took the biggest hit at -28.5%. India (-14.8%), Brazil (-11.9%), and Switzerland (-6.5%) followed. Canada (-4.0%) also landed with a slight disadvantage.
Tariff Revenue by Country
So what does this mean for tariff revenue for the U.S.?
Hypothetical numbers from Global Trade Alert show what additional revenue would be provided if 2024 trade levels were to continue without any supply and demand adjustments. Trade with China is projected to generate the most tariff revenue by far, with $205.2 billion. Mexico ($84.1 billion) and Canada ($78.8 billion) round out the top three.
Tariffs paid for imports from
India ($33.0 billion), Japan ($32.3 billion), and Germany ($29.9 billion) are also set to generate sizable sums. The UK, by contrast, is forecasted to contribute just $4.8 billion.
The Shifting U.S. Trade Landscape
Trump’s tariffs reshaped the global trade landscape, hitting some countries hard while giving others a competitive edge. Both relative advantages and tariff revenues clearly show the ripple effects, underscoring how unevenly the costs and benefits are distributed.

Visit the Hinrich Foundation to learn more about the future of global trade.
-
 Economy1 month ago
Charting How U.S. Tariffs Will Hit Key Products
U.S. tariffs have climbed to an average rate of 18.6%—the highest since 1933. But what does this mean for everyday consumers?
-
 Economy4 months ago
Breaking Down the $450 Billion of Trade Destruction from U.S. Tariffs
The UN has crunched the numbers projecting the ripple effects of Trump’s May 12th tariffs. Which economies are bracing for the biggest hits?
-

 Economy5 months ago
Ranked: America’s Services Trade Balances
America’s goods trade deficits have dominated headlines, but a critical part of the equation is being ignored: services trade.
-
 AI7 months ago
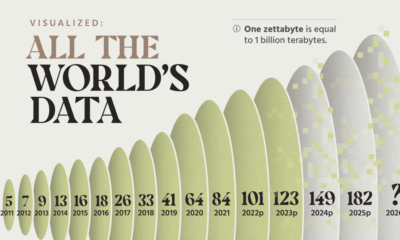
Visualized: All of the World’s Data
More data will be created, captured, and replicated in the next three years than in the rest of human history. But by how much?
-

 Economy7 months ago
Visualized: The Growing Opportunities in Global Trade Careers
Visual Capitalist has partnered with the Hinrich Foundation to explore the landscape of global trade and find out what students and trade professionals can do to…
-
 Green7 months ago
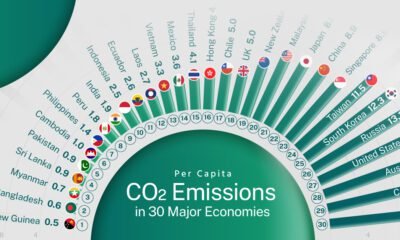
Ranked: CO₂ Emissions Per Person in 30 Economies
CO₂ emissions are reshaping the flows of international trade. Which countries have the highest and lowest CO₂ emissions per capita
-
 Healthcare9 months ago
Mapped: Life Expectancy in Major Economies
Which countries have the highest and lowest life expectancies at birth?
-
 Markets11 months ago
Ranked: Government Debt Across Major Economies
Based on data from the IMF’s World Economic Outlook, which countries have the highest and lowest government debt ratios?
-
 Markets11 months ago
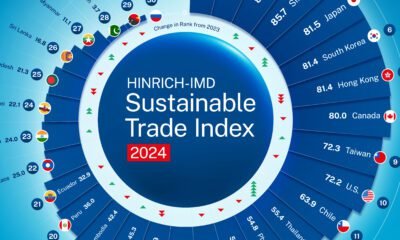
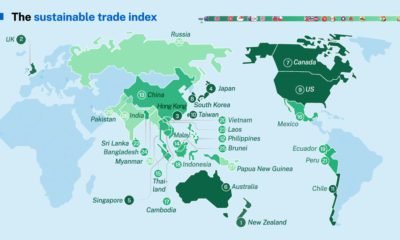
Ranked: The World’s Most Sustainable Economies in 2024
Based on the Hinrich Foundation’s 2024 Sustainable Trade Index, which economies are the most and least sustainable?
-
 Oil and Gas1 year ago
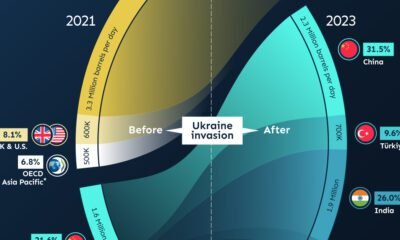
How Oil Is Adding Fuel to Geopolitical Fragmentation
Which countries and regions decreased, banned, or increased Russian oil imports following the 2022 invasion of Ukraine?
-
 Politics1 year ago
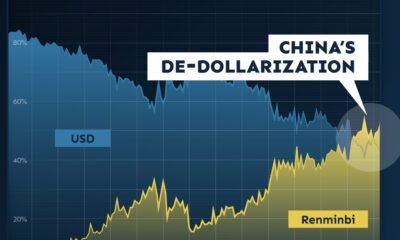
The Start of De-Dollarization: China’s Gradual Move Away from the USD
The de-dollarization of China’s trade settlements has begun. What patterns do we see in USD and RMB use within China and globally?
-
 Politics1 year ago
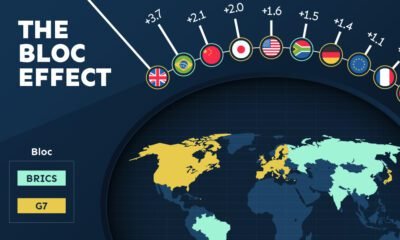
The Bloc Effect: International Trade with Geopolitical Allies on the Rise
Rising geopolitical tensions are shaping the future of international trade, but what is the effect on trading among G7 and BRICS countries?
-
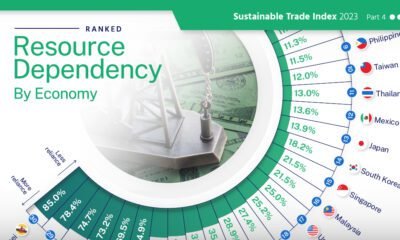
 Green2 years ago
Ranked: Resource Dependency Across 30 Major Economies
High resource dependency in trade makes countries more susceptible to market fluctuations and climate change.
-
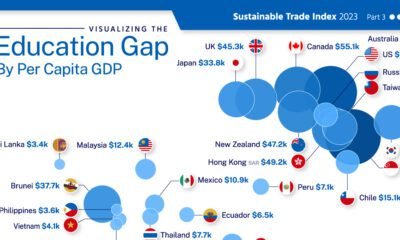
 Misc2 years ago
Visualizing the Global Education Gap
This graphic adds visual context to the global education gap, using data from 29 major economies.
-
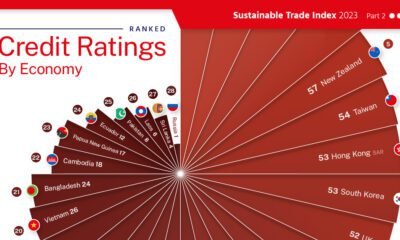
 Money2 years ago
Ranking the Credit Ratings of Major Economies
This graphic visualizes 30 country’s credit ratings, using data from the 2023 Sustainable Trade Index.
-
 Economy2 years ago
Ranked: The World’s Most Sustainable Economies in 2023
The Sustainable Trade Index 2023 is an annual ranking of the world’s most sustainable economies. View this infographic to see the results.
-
 Economy2 years ago
Visualizing the Impact of the G20’s Corporate Subsidies
The Hinrich Foundation visualizes the impact of corporate subsidies by G20 nations between 2008 and Q1 2023.
-
 Economy2 years ago
Economic Coercion: China’s Leverage in Trade
The Hinrich Foundation explores China’s use of economic coercion and the implications of its control over the solar energy sector.
-
 Politics2 years ago
Ranking the Trade Policies of the G20
We analyze recent trade policies implemented by G20 members to determine whether they are liberalizing or harmful.
-
 Green2 years ago
Global Carbon Markets: Highlights from the Latest Report
We highlight key findings from the Hinrich Foundation’s latest report on carbon markets, produced in partnership with Visual Capitalist.
-
 Green3 years ago
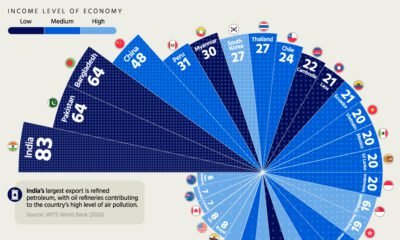
Ranked: Air Pollution by Economy
Which economies have hazy air, and which ones enjoy mostly clear skies? Find out in this geographic breakdown of air pollution levels.
-
 Politics3 years ago
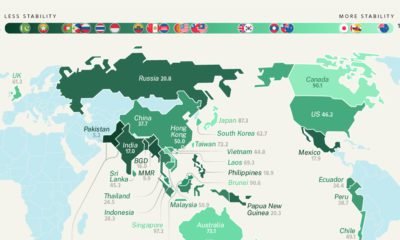
Mapped: Geopolitical Risk by Economy
Prior to invading Ukraine, Russia had one of the highest levels of geopolitical risk. How does geopolitical uncertainty vary around the world?
-
 Economy3 years ago
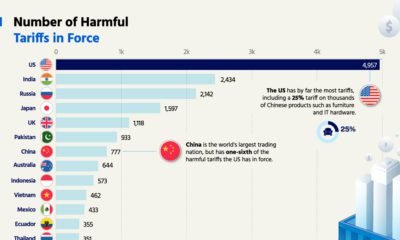
Ranked: Harmful Tariffs by Economy
The U.S. has by far the most harmful tariffs, with nearly 5,000 in force. Which economy has the least tariffs?
-
 Business3 years ago
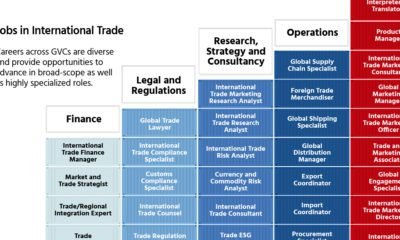
Interested in a Career in Global Trade?
Global trade is growing across regions and countries which is creating an explosion in new jobs and education opportunities.
-
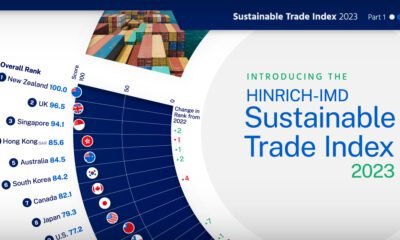
 Economy3 years ago
Introducing the 2022 Sustainable Trade Index
See which economies have the most sustainable trade policies in the Hinrich Foundation’s 2022 Sustainable Trade Index.
-
 Economy3 years ago
Global Trade Series: Fragmentation in the Digital Economy
In this infographic, we examine the current state of digital fragmentation and it’s implications on the world.
-
 Economy3 years ago
Global Trade Series: Asia’s Digital Economy
Asia’s digital economy is expanding quicker than ever, but cooperation between governments is needed to reduce barriers.
-
 Economy3 years ago
Global Trade Series: The Benefits of Free Trade
Free trade is a powerful engine for economic growth, but rising protectionism stands in the way. See what the data says in this infographic.