Countries Spending the Most on Research and Development
See visuals like this from many other data creators on our Voronoi app. Download it for free on iOS or Android and discover incredible data-driven charts from a variety of trusted sources.
Key Takeaways
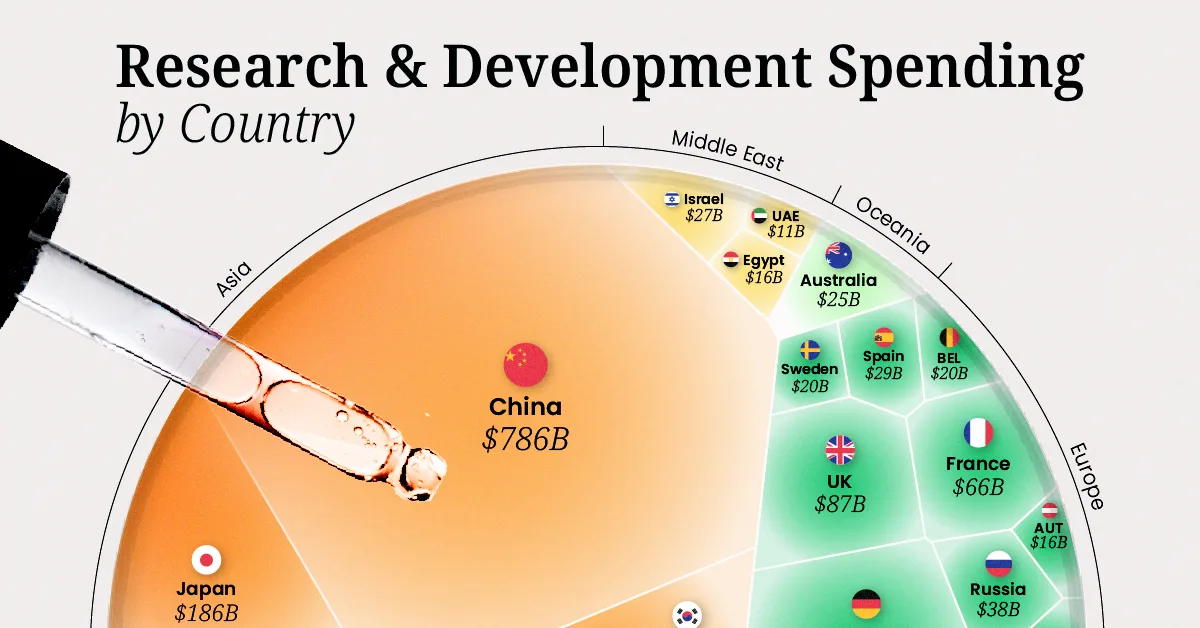
- China spent $785.9 billion in research and development (R&D) in 2024, surpassing the U.S. for the first time ever.
- Global R&D spending reached $2.9 trillion that year, with 45% driven from countries in Asia.
For decades, the U.S. stood as the global leader in research and development (R&D) spending, however, China is increasingly challenging the scientific balance of power.
Backed by rapid growth and strategic investment, China’s share of global R&D has surged from 4.0% in 2000 to 27.4% in 2024. South Korea and India are also increasing their R&D presence, helping push Asia to the forefront of global innovation.
This graphic shows R&D spending by country, based on data from the World Intellectual Property Organization.
The Global Leaders in R&D Spending
Below, we rank countries by their R&D spending (in purchasing power parity-adjusted constant 2015 U.S. dollars):
| Ranking | Country | R&D Spending 2024 |
Global Share | R&D Spending (% of GDP) |
|---|---|---|---|---|
| 1 |  China China |
$785.9B | 27.4% | 2.7% |
| 2 |  U.S. U.S. |
$781.8B | 27.2% | 3.5% |
| 3 |  Japan Japan |
$186.0B | 6.5% | 3.5% |
| 4 |  Germany Germany |
$132.2B | 4.6% | 3.1% |
| 5 |  South Korea South Korea |
$126.4B | 4.4% | 5.3% |
| 6 |  UK UK |
$86.5B | 3.0% | 2.8% |
| 7 |  India India |
$75.7B | 2.6% | 0.7% |
| 8 |  France France |
$65.8B | 2.3% | 2.2% |
| 9 |  Türkiye Türkiye |
$43.2B | 1.5% | 1.4% |
| 10 |  Brazil Brazil |
$38.4B | 1.3% | 1.2% |
| 11 |  Russia Russia |
$38.1B | 1.3% | 0.9% |
| 12 |  Canada Canada |
$33.2B | 1.2% | 1.8% |
| 13 |  Italy Italy |
$32.5B | 1.1% | 1.3% |
| 14 |  Spain Spain |
$29.0B | 1.0% | 1.5% |
| 15 |  Israel Israel |
$26.5B | 0.9% | 6.3% |
| 16 |  Australia Australia |
$25.1B | 0.9% | 1.9% |
| 17 |  Netherlands Netherlands |
$23.0B | 0.8% | 2.2% |
| 18 |  Switzerland Switzerland |
$20.8B | 0.7% | 3.3% |
| 19 |  Belgium Belgium |
$19.9B | 0.7% | 3.3% |
| 20 |  Sweden Sweden |
$19.9B | 0.7% | 3.6% |
| 21 |  Egypt Egypt |
$16.4B | 0.6% | 1.0% |
| 22 |  Austria Austria |
$15.6B | 0.5% | 3.3% |
| 23 |  Thailand Thailand |
$15.1B | 0.5% | 1.2% |
| 24 |  Singapore Singapore |
$11.7B | 0.4% | 1.9% |
| 25 |  UAE UAE |
$11.4B | 0.4% | 1.5% |
| 26 |  Denmark Denmark |
$10.4B | 0.4% | 3.0% |
| 27 |  Malaysia Malaysia |
$10.2B | 0.4% | 1.0% |
China ranks first globally, spending $785.9 billion on R&D in 2024.
Much of that investment is shaped by China’s centralized funding model, where a large share of research flows through government labs aligned with national priorities such as energy, biotech, and frontier technologies.
The U.S. ranks second at $781.8 billion. Unlike China, American R&D is driven primarily by the private sector, with Amazon, Alphabet, and Meta among the world’s largest corporate R&D investors.
Together, China and the U.S. R&D investment account for 54.7% of the global total.
Japan ranks a distant third, investing $186.0 billion in 2024. Since 2000, its share of global R&D has fallen by 7.2 percentage points, the second-largest decline after the U.S. Toyota has long led corporate R&D spending in Japan, with Honda also investing heavily.
Europe also places three countries in the global top 10, including Germany (#4), the UK (#6), and France (#8). However, each has seen its share of global R&D shrink since 2000.
Still, there are bright spots. In 2024, EU corporate R&D investment rose 13.0% in healthcare, while energy surged 19.8%, outpacing growth in China, the U.S., and Japan.
Learn More on the Voronoi App 
To learn more about this topic, check out this graphic on the Global Innovation Index in 2025.