Ranked: Countries With the Most Patents
See visuals like this from many other data creators on our Voronoi app. Download it for free on iOS or Android and discover incredible data-driven charts from a variety of trusted sources.
Key Takeaways
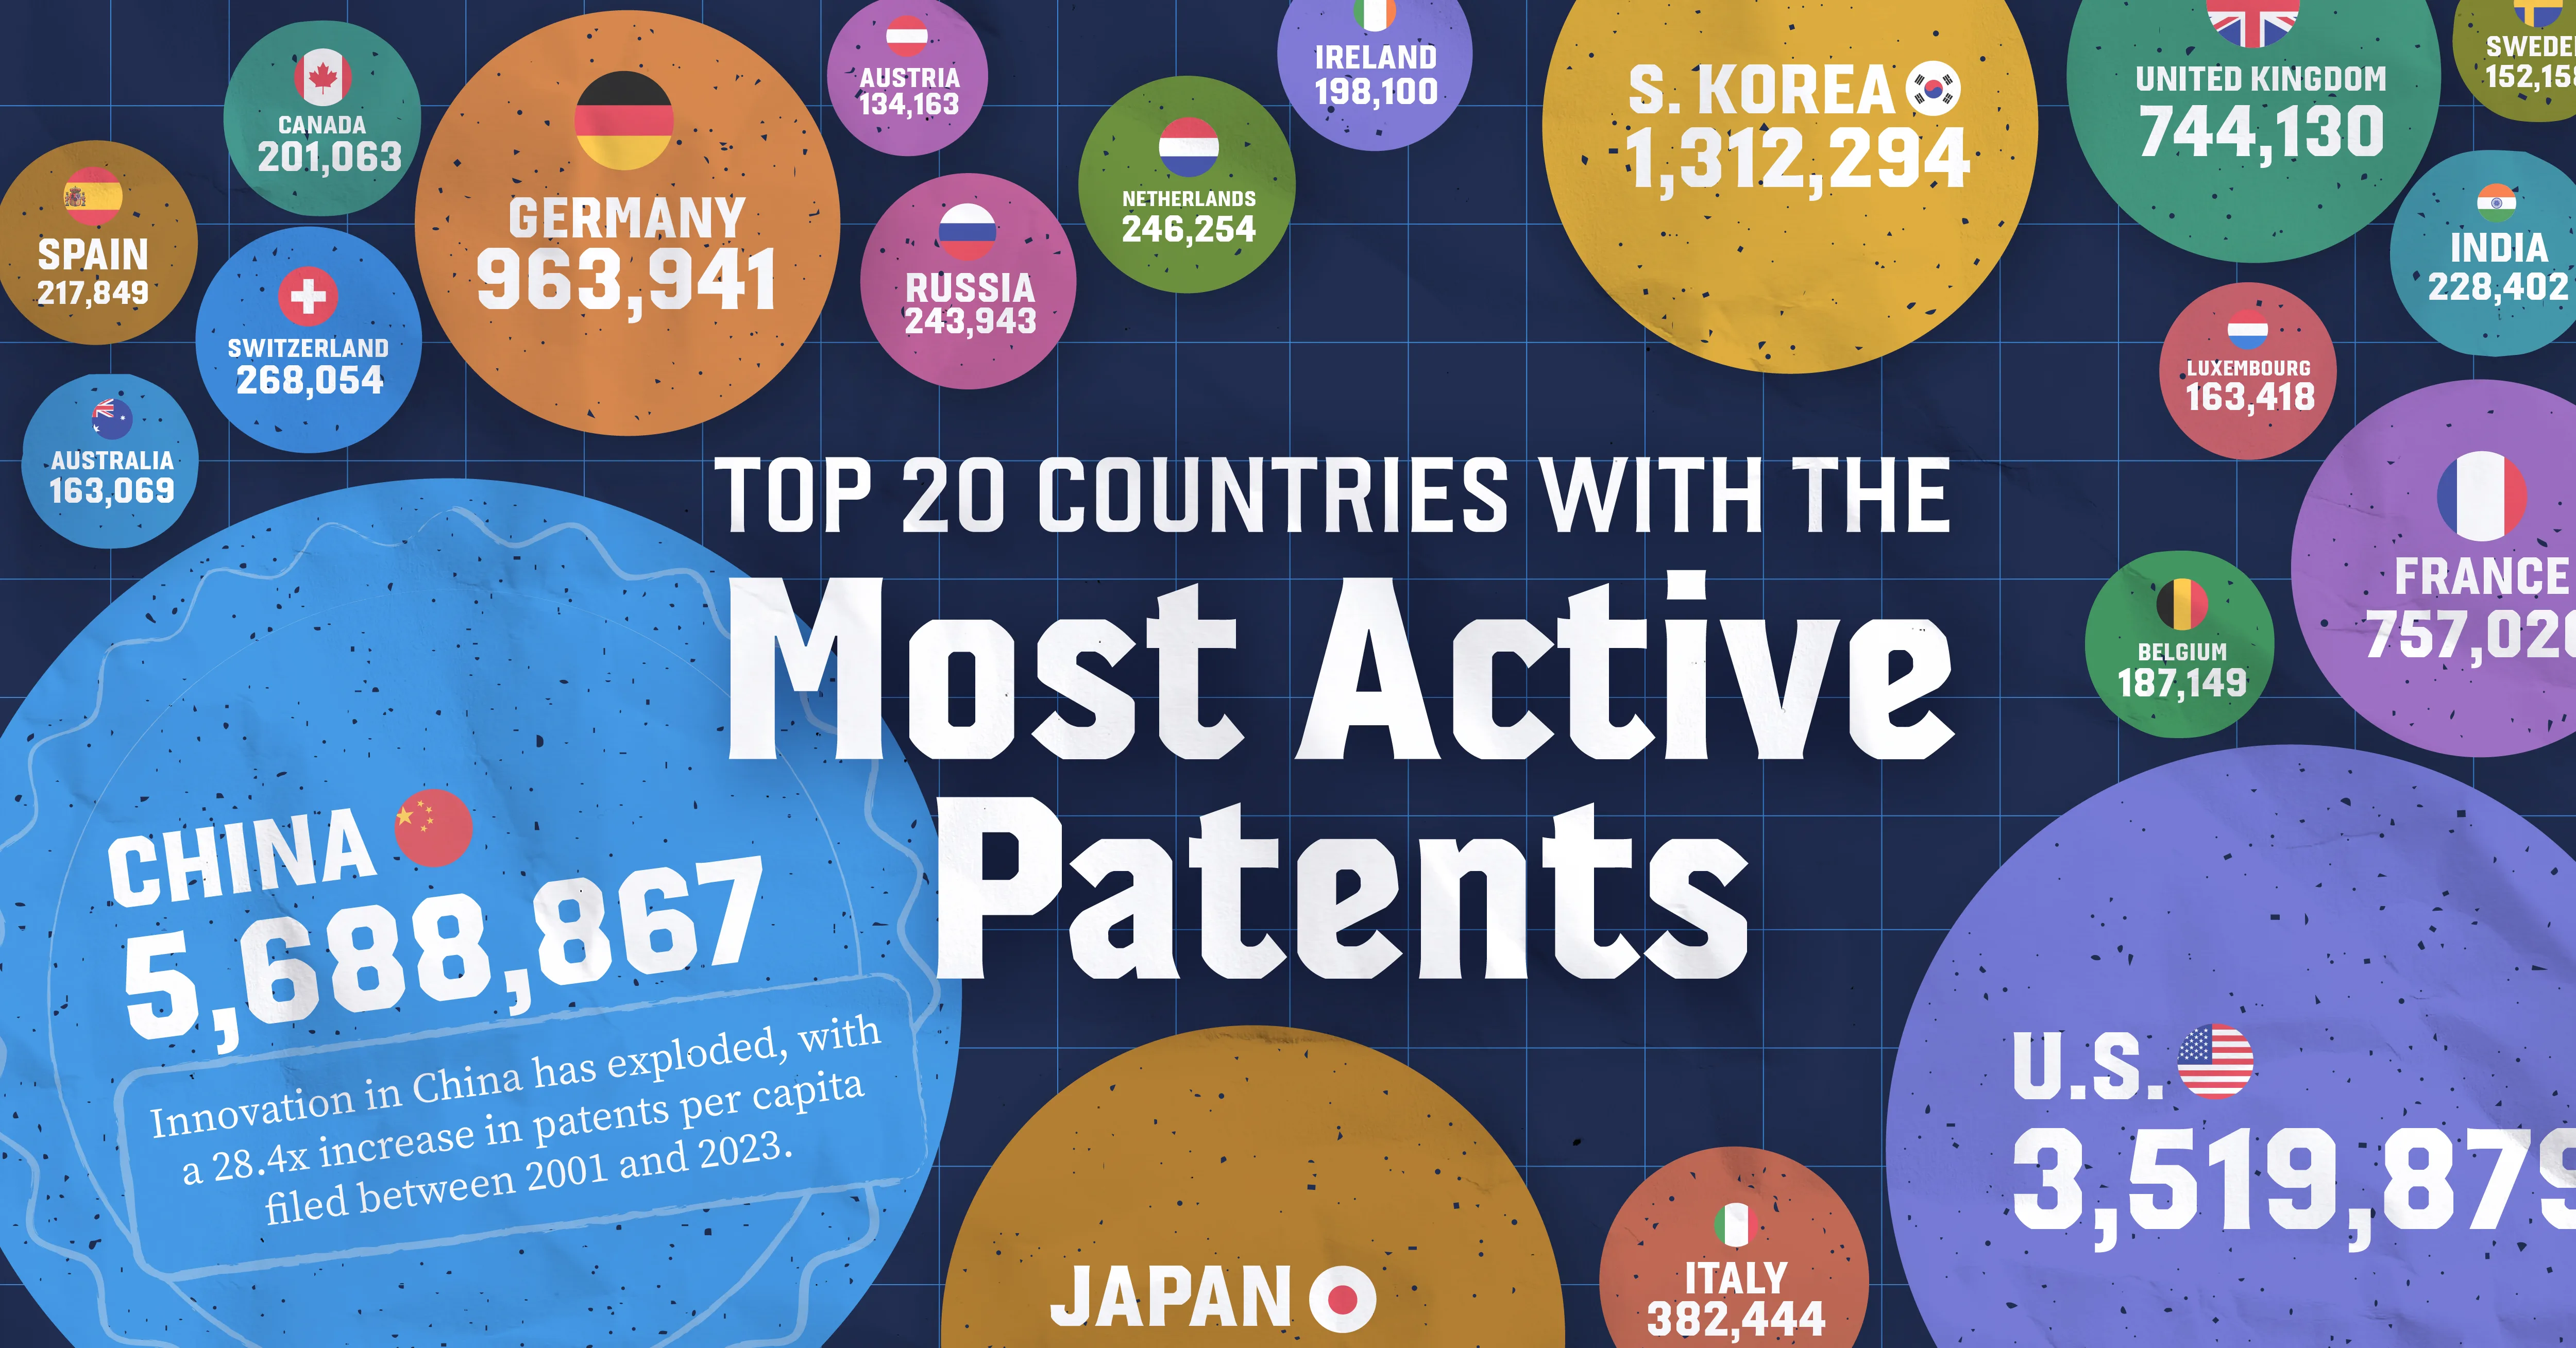
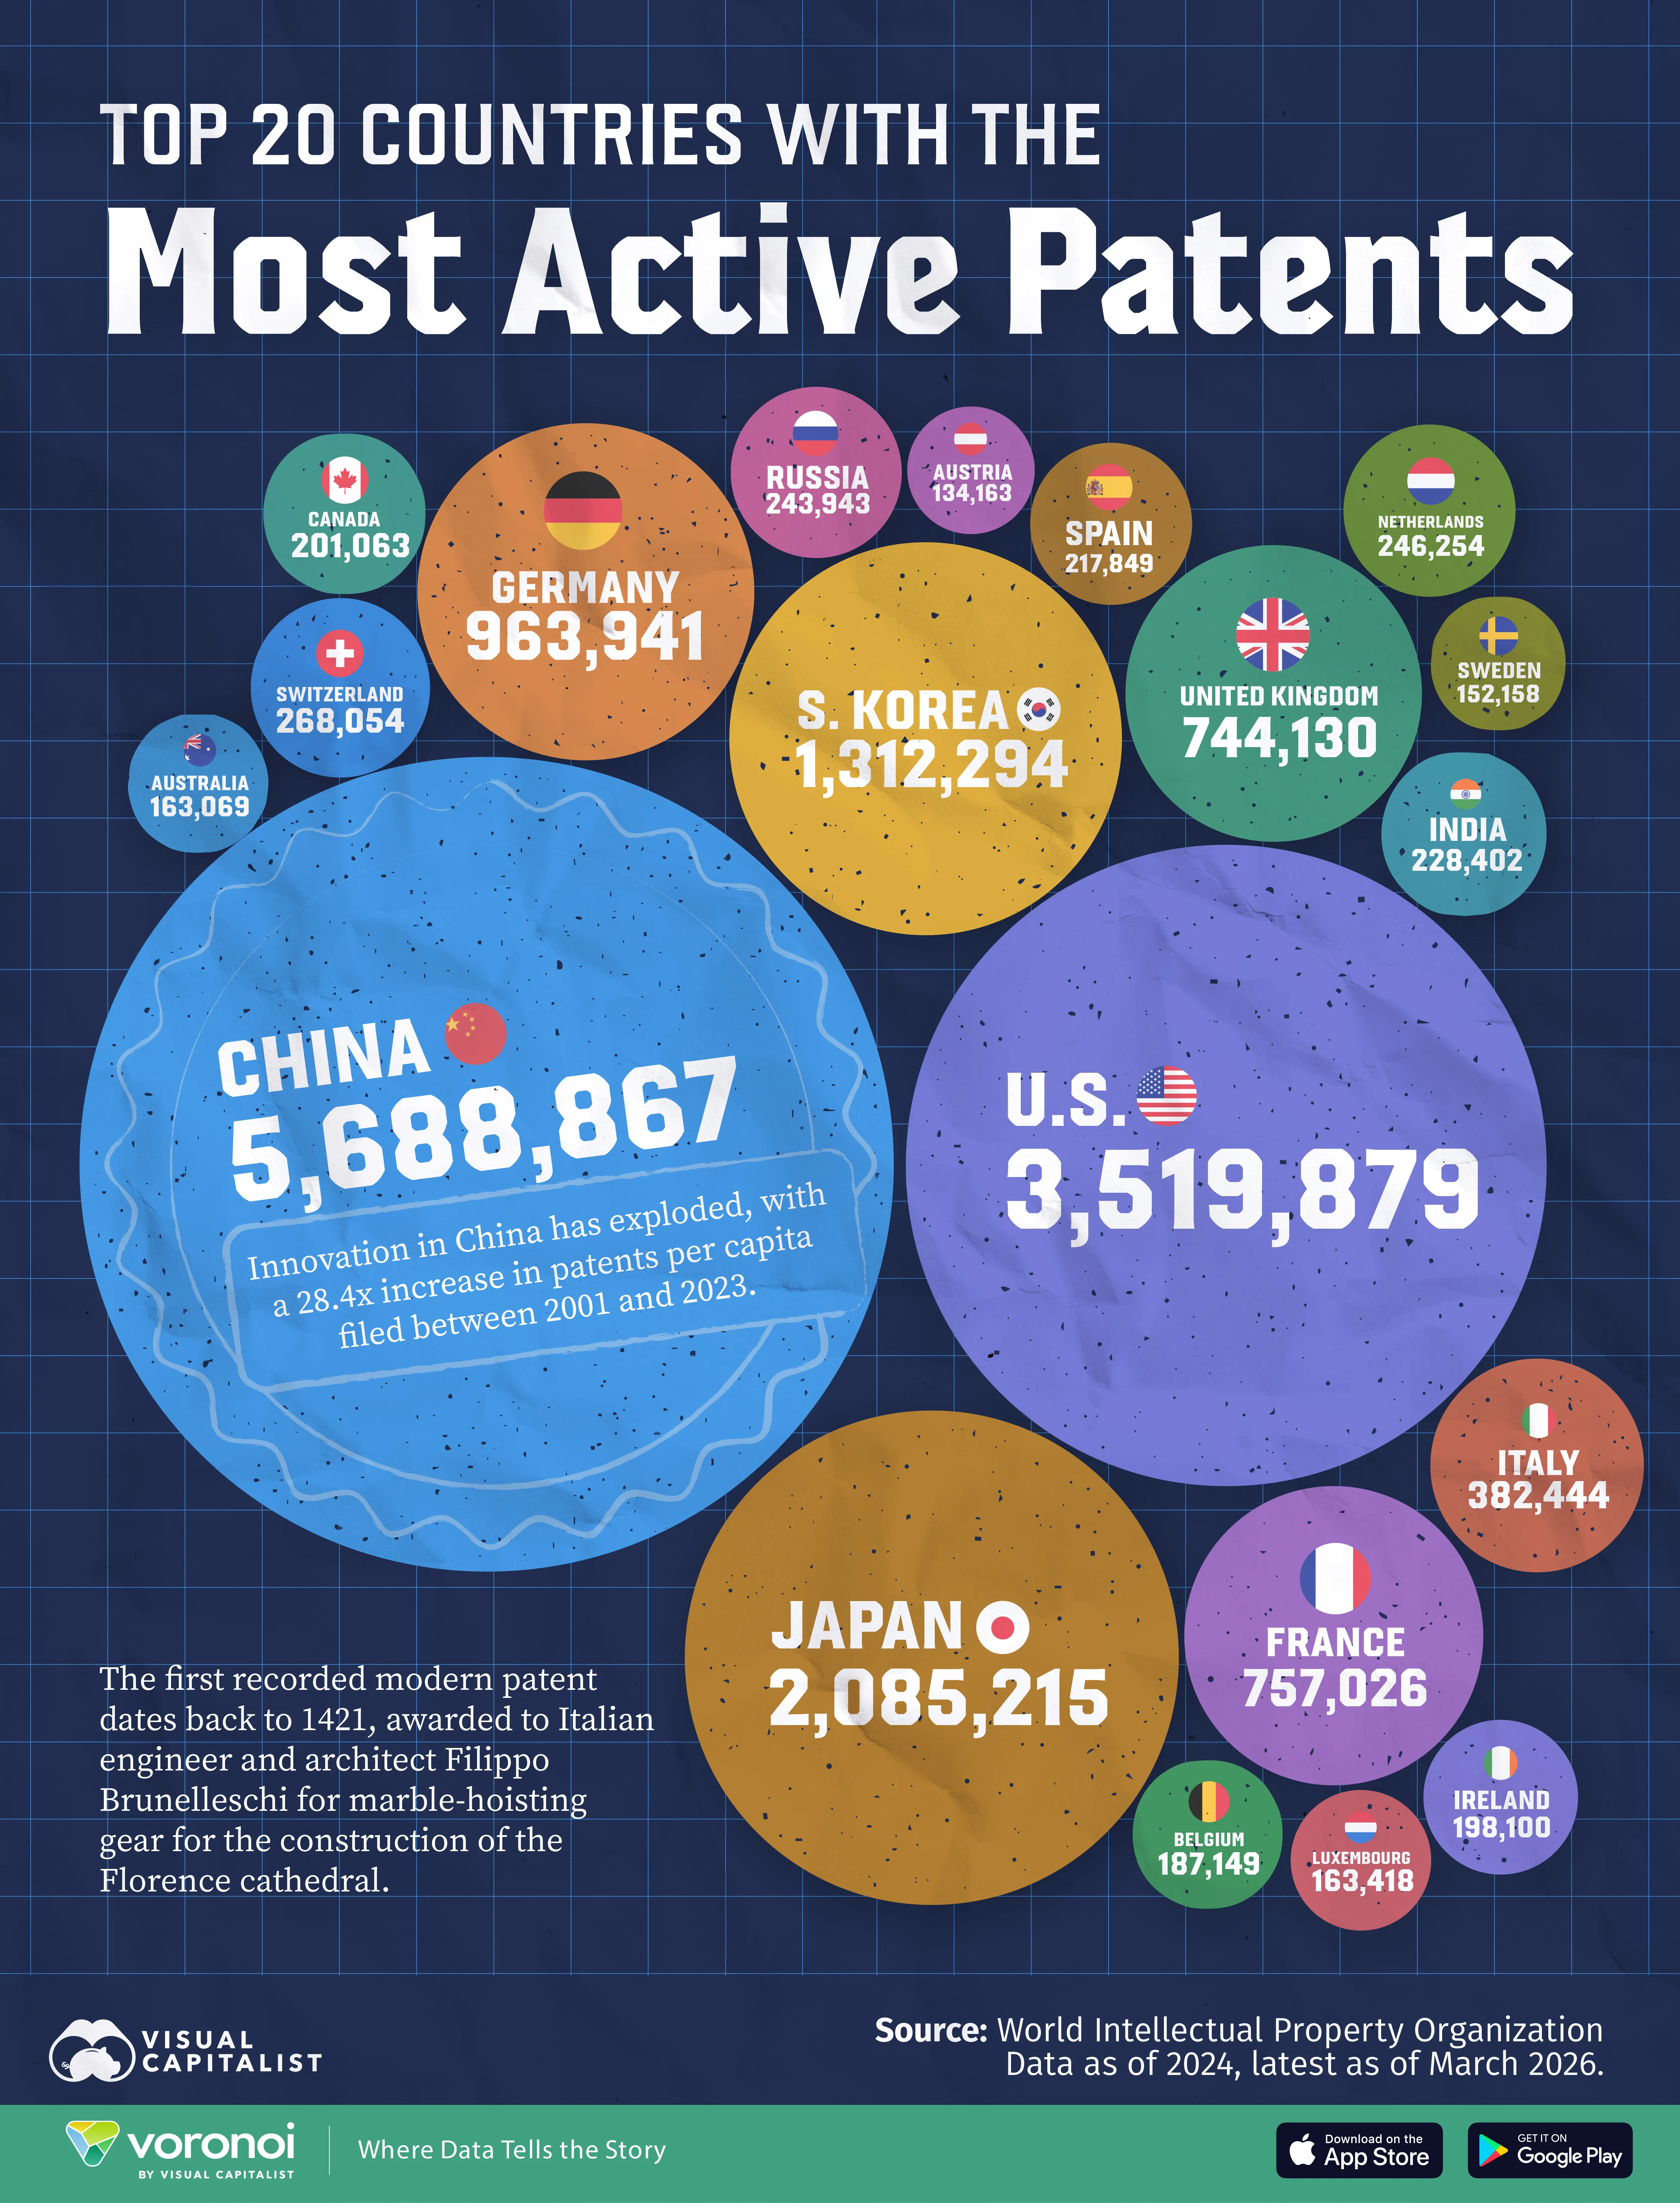
- China leads the world with 5.7 million active patents, far ahead of any other country.
- The U.S. (3.5M) and Japan (2.1M) rank second and third, respectively.
- Together, the top three countries hold more patents than the rest of the world combined.
A handful of countries dominate global patent activity, with a steep drop-off after the top ranks. China alone accounts for a massive share, holding millions more active patents than any other country.
This visualization ranks countries by total active patents using the latest available data from the World Intellectual Property Organization for 2024.
China Is Miles Ahead on Active Patents
China leads with 5.7 million active patents, followed by the United States and Japan, and together the top three exceed the rest of the world combined.
| Country | Number of Active Patents |
|---|---|
 China China |
5,688,867 |
 United States United States |
3,519,879 |
 Japan Japan |
2,085,215 |
 South Korea South Korea |
1,312,294 |
 Germany Germany |
963,941 |
 France France |
757,026 |
 United Kingdom United Kingdom |
744,130 |
 Italy Italy |
382,444 |
 Switzerland Switzerland |
268,054 |
 The Netherlands The Netherlands |
246,254 |
 Russia Russia |
243,943 |
 India India |
228,402 |
 Spain Spain |
217,849 |
 Canada Canada |
201,063 |
 Ireland Ireland |
198,100 |
 Belgium Belgium |
187,149 |
 Luxembourg Luxembourg |
163,418 |
 Australia Australia |
163,069 |
 Sweden Sweden |
152,158 |
 Austria Austria |
134,163 |
 Monaco Monaco |
120,437 |
 Poland Poland |
111,782 |
 Mexico Mexico |
111,190 |
 Denmark Denmark |
109,551 |
 Brazil Brazil |
106,827 |
 South Africa South Africa |
104,012 |
 Finland Finland |
96,416 |
 Türkiye Türkiye |
89,401 |
 Indonesia Indonesia |
84,540 |
 Portugal Portugal |
81,509 |
 Hong Kong Hong Kong |
73,249 |
 Norway Norway |
55,349 |
 Czechia Czechia |
50,433 |
 Singapore Singapore |
49,667 |
 Iran Iran |
44,453 |
 Israel Israel |
41,001 |
 Malaysia Malaysia |
38,168 |
 Hungary Hungary |
35,950 |
 Greece Greece |
27,510 |
 Romania Romania |
27,474 |
 Thailand Thailand |
24,635 |
 New Zealand New Zealand |
23,867 |
 Viet Nam Viet Nam |
23,291 |
 Slovakia Slovakia |
21,189 |
 Chile Chile |
21,079 |
 Ukraine Ukraine |
20,445 |
 Slovenia Slovenia |
18,517 |
 Philippines Philippines |
15,463 |
 Saudi Arabia Saudi Arabia |
14,739 |
 Croatia Croatia |
13,431 |
 Bulgaria Bulgaria |
13,311 |
 Argentina Argentina |
13,053 |
 Lithuania Lithuania |
12,414 |
 Estonia Estonia |
10,684 |
 Latvia Latvia |
10,493 |
 Iceland Iceland |
9,501 |
 Serbia Serbia |
9,368 |
 Colombia Colombia |
9,009 |
 Zambia Zambia |
8,562 |
 Malta Malta |
7,385 |
 Algeria Algeria |
7,039 |
 Macao Macao |
5,777 |
 North Macedonia North Macedonia |
5,528 |
 Iraq Iraq |
5,141 |
 Egypt Egypt |
5,107 |
 Morocco Morocco |
4,917 |
 United Arab Emirates United Arab Emirates |
4,587 |
 Peru Peru |
4,539 |
 Ghana Ghana |
3,326 |
 Kazakhstan Kazakhstan |
2,837 |
 Bangladesh Bangladesh |
2,203 |
 Pakistan Pakistan |
2,157 |
 Panama Panama |
2,076 |
 Mongolia Mongolia |
1,656 |
 Costa Rica Costa Rica |
1,462 |
 Belarus Belarus |
1,371 |
 Uzbekistan Uzbekistan |
1,255 |
 Dominican Republic Dominican Republic |
1,194 |
 Uruguay Uruguay |
1,138 |
 Sri Lanka Sri Lanka |
1,007 |
 El Salvador El Salvador |
918 |
 Georgia Georgia |
836 |
 Trinidad and Tobago Trinidad and Tobago |
830 |
 Syria Syria |
666 |
 Bahrain Bahrain |
571 |
 Qatar Qatar |
569 |
 Jamaica Jamaica |
451 |
 Honduras Honduras |
446 |
 Cuba Cuba |
421 |
 Namibia Namibia |
415 |
 Azerbaijan Azerbaijan |
403 |
 Zimbabwe Zimbabwe |
403 |
 Oman Oman |
355 |
 Ethiopia Ethiopia |
322 |
 Paraguay Paraguay |
257 |
 Moldova Moldova |
255 |
 Madagascar Madagascar |
232 |
 Guatemala Guatemala |
218 |
 Ecuador Ecuador |
215 |
 Venezuela Venezuela |
208 |
 Kyrgyzstan Kyrgyzstan |
186 |
 Sao Tome and Principe Sao Tome and Principe |
153 |
 Kuwait Kuwait |
74 |
 Bosnia and Herzegovina Bosnia and Herzegovina |
69 |
 Barbados Barbados |
63 |
 Andorra Andorra |
48 |
 Saint Vincent and the Grenadines Saint Vincent and the Grenadines |
20 |
 Armenia Armenia |
17 |
 Uganda Uganda |
17 |
 Cyprus Cyprus |
10 |
 Bhutan Bhutan |
6 |
 Myanmar Myanmar |
4 |
South Korea takes the fourth spot for most active patents, with 1.3 million. It underscores Asia’s strong presence among the world’s leading innovation hubs.
It’s unsurprising to see these countries in the top ranks, given the size of their economies and populations, though South Korea becomes an outlier through this lens.
Germany is the top European country, at 963,941, but active patents dip significantly from there to 757,026 for France.
Myanmar, which brought in its first ever law dedicated to patent protection and innovation in 2024, sits at the bottom of the dataset with four patents. It is only one of two — the other being Bhutan, which has six active patents — to have fewer than 10 active patents.
Most Countries Contribute Little to Global Innovation
Global patent ownership is highly concentrated, with a small number of countries accounting for the majority of innovation output.
While countries like China, the U.S., and Japan dominate the landscape, most nations contribute relatively small numbers of active patents. This gap highlights differences in research capacity, industrial scale, and investment in innovation.
Learn More on the Voronoi App 
To learn more about innovation, check out this graphic which ranks top startup hubs.