Ranked: European Countries with the Most Immigrants
This was originally posted on our Voronoi app. Download the app for free on iOS or Android and discover incredible data-driven charts from a variety of trusted sources.
Key Takeaways
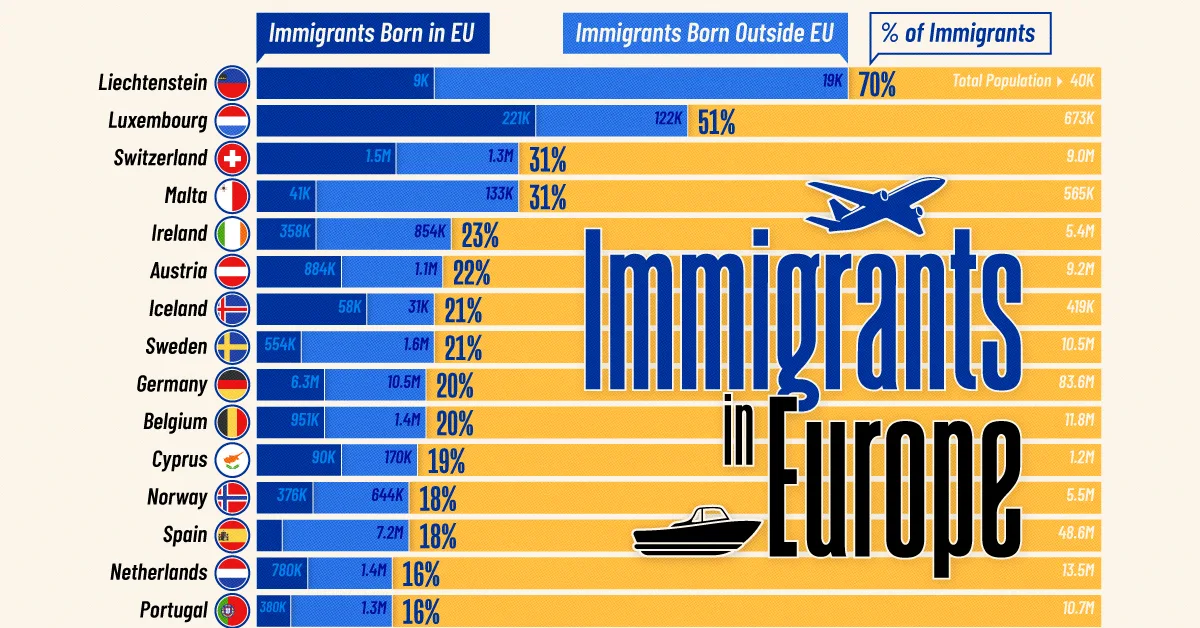
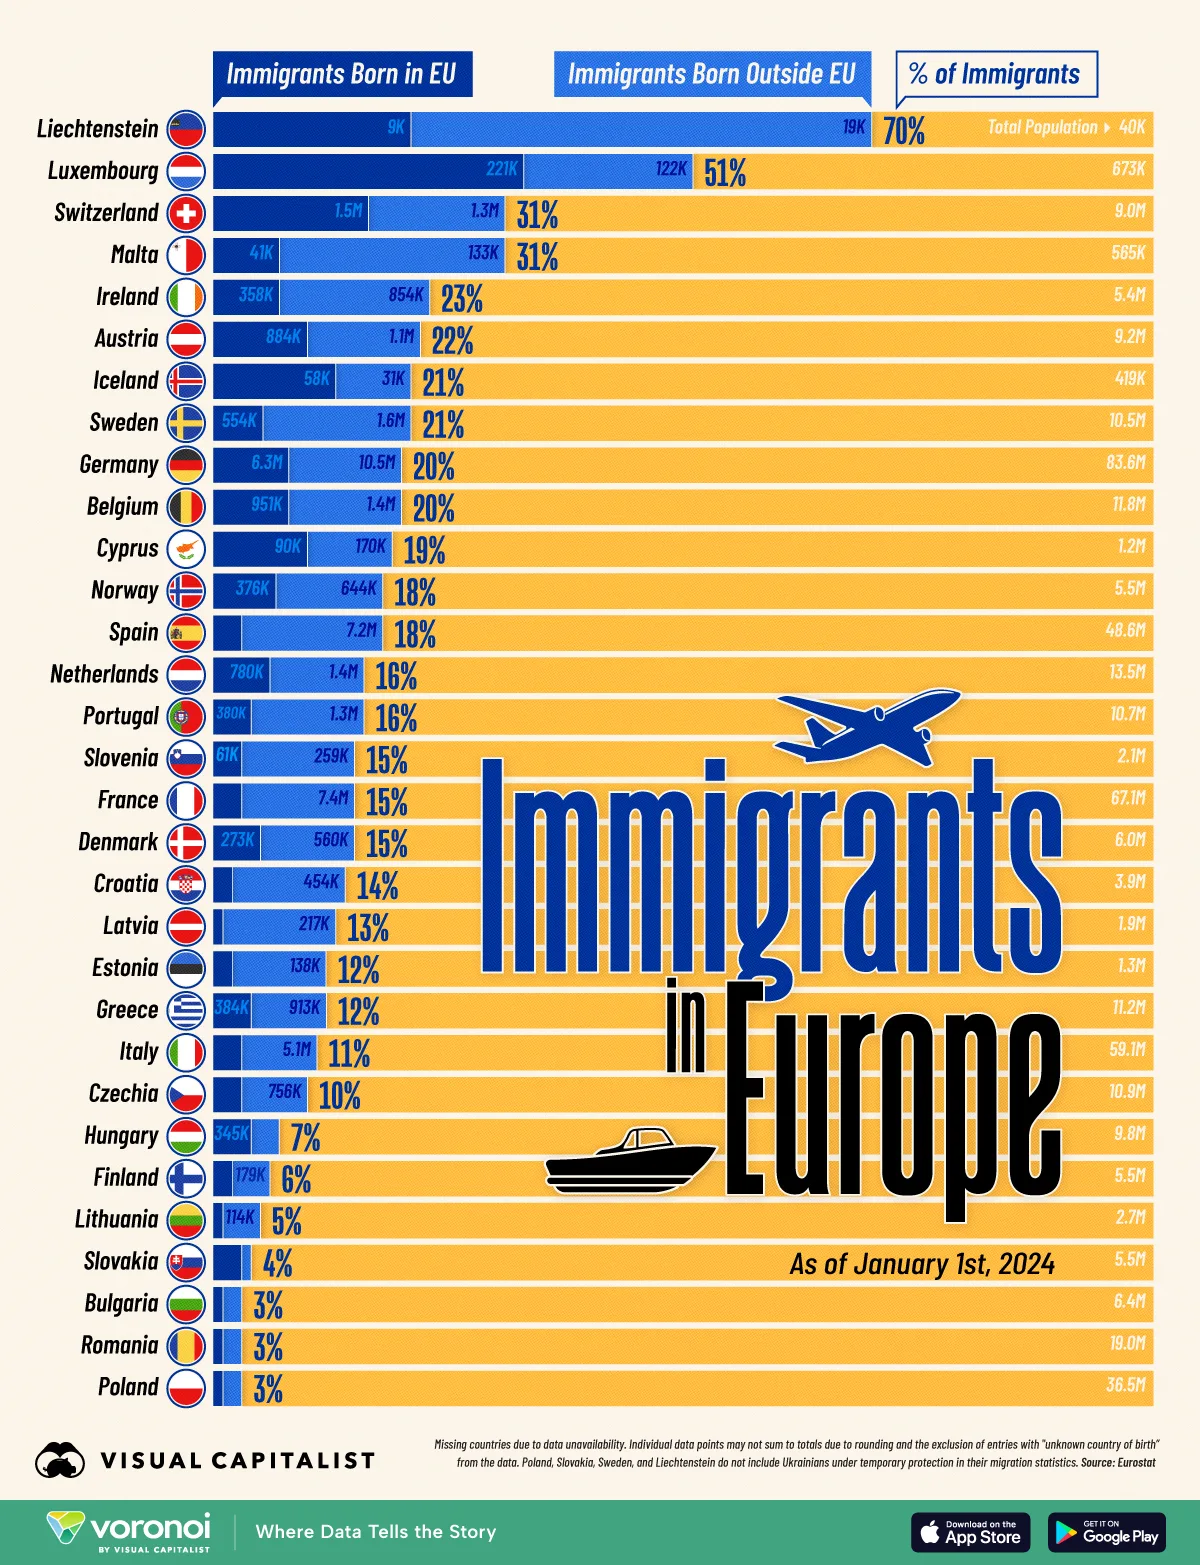
- Liechtenstein tops the list of European countries with the most immigrants. 70% of its 40,000 residents were born abroad, and roughly two-thirds hail from outside the EU.
- Meanwhile, Germany tops the list with the most immigrants by absolute numbers alone.
- 16.9 million people, equal to one-fifth of Germany’s population, were born abroad, of which one in eight are EU-born.
The infographic visualizes ranks 31 European countries by the share of immigrants, and lists their absolute numbers for further context.
Data for this visualization come from Eurostat, which tracks resident populations by country of birth as of January 1, 2024.
 See the last section for who is included in this data.
These Are the European Countries With the Most Immigrants
Liechtenstein’s 70% foreign-born share stands out, but Luxembourg (51%) and Malta (31%) also depend heavily on immigrants.
| Rank | Country | % of Immigrants | # of Immigrants (Thousands) |
Born in the EU (Thousands) |
Born Outside the EU (Thousands) |
|---|---|---|---|---|---|
| 1 |  Liechtenstein Liechtenstein |
70 | 28 | 9 | 19 |
| 2 |  Luxembourg Luxembourg |
51 | 343 | 221 | 122 |
| 3 |  Switzerland Switzerland |
31 | 2,795 | 1,494 | 1,301 |
| 4 |  Malta Malta |
31 | 174 | 41 | 133 |
| 5 |  Ireland Ireland |
23 | 1,224 | 358 | 854 |
| 6 |  Austria Austria |
22 | 2,023 | 884 | 1,140 |
| 7 |  Iceland Iceland |
21 | 88 | 58 | 31 |
| 8 |  Sweden Sweden |
21 | 2,169 | 554 | 1,615 |
| 9 |  Germany Germany |
20 | 16,881 | 6,348 | 10,533 |
| 10 |  Belgium Belgium |
20 | 2,324 | 951 | 1,373 |
| 11 |  Cyprus Cyprus |
19 | 237 | 90 | 170 |
| 12 |  Norway Norway |
18 | 1,020 | 376 | 644 |
| 13 |  Spain Spain |
18 | 8,838 | 1,593 | 7,246 |
| 14 |  Netherlands Netherlands |
16 | 2,195 | 780 | 1,415 |
| 15 |  Portugal Portugal |
16 | 1,704 | 380 | 1,324 |
| 16 |  Slovenia Slovenia |
15 | 320 | 61 | 259 |
| 17 |  France France |
15 | 9,928 | 1,966 | 7,363 |
| 18 |  Denmark Denmark |
15 | 884 | 273 | 560 |
| 19 |  Croatia Croatia |
14 | 520 | 66 | 454 |
| 20 |  Latvia Latvia |
13 | 239 | 22 | 217 |
| 21 |  Estonia Estonia |
12 | 164 | 26 | 138 |
| 22 |  Greece Greece |
12 | 1,298 | 384 | 913 |
| 23 |  Italy Italy |
11 | 6,673 | 1,599 | 5,074 |
| 24 |  Czechia Czechia |
10 | 1,070 | 314 | 756 |
| 25 |  Hungary Hungary |
7 | 694 | 345 | 332 |
| 26 |  Finland Finland |
6 | 313 | 134 | 179 |
| 27 |  Lithuania Lithuania |
5 | 134 | 20 | 114 |
| 28 |  Slovakia Slovakia |
4 | 214 | 156 | 59 |
| 29 |  Bulgaria Bulgaria |
3 | 212 | 68 | 144 |
| 30 |  Romania Romania |
3 | 588 | 218 | 371 |
| 31 |  Poland Poland |
3 | 936 | 236 | 700 |
Note: Missing countries due to data unavailability. Individual data points may not sum to totals due to rounding and the exclusion of entries with “unknown country of birth” from the data.
Their small domestic workforces, favorable tax regimes, and cross-border job markets create strong pull factors.
In all three, non-EU migrants make up a majority, underscoring their roles as global—not just European—talent hubs.
Related: Liechtenstein is not an EU member, along with Iceland, Norway, and Switzerland, but they are all part of the Schengen Agreement and the Eurozone.Germany Has the Most Immigrants in Europe
With 16.9 million immigrants, Germany alone accounts for one-quarter of all foreign-born residents in the EU.
Its aging population and robust manufacturing base drive consistent demand for labor.
Yet only 37% of these arrivals come from within the EU, suggesting that Germany’s pull extends well beyond the continent, and reflects broader geopolitical magnetism, including Middle-Eastern and Asian inflows.
Related: Germany’s median age is 47, it’s the 9th oldest country in the world by this metric.Europe’s East-West Migration Patterns
Western and Northern Europe average immigrant shares above 15%, while many Eastern states linger below 5%.
Poland (3%) and Romania (3%) sit at the bottom.
This is a reflection of the East-West migration path
While economic convergence has narrowed wage gaps between the two sides of Europe, western job markets and higher living standards still attract Eastern Europeans, leaving a noticeable demographic imbalance across the EU.
Related: Many Eastern European countries have fewer residents now than in 1990.What Kind of Immigrants are Included in the Data
Most EU member states rely on administrative data to report to the EU, such as registers for population, foreigners, residence, work permits, health insurance, or tax.
Thus, this data will not include immigrants who entered illegally or who reside in a way not captured by a government agency.
Furthermore, every country except for these four listed—Poland, Slovakia, Sweden, and Liechtenstein—include Ukrainians under temporary residence or refugee permits in their migration statistics.
Immigrants have to reside in the country for more than 12 months to be counted.
Related: Where is the UK? Since Brexit, Eurostat stopped collecting and publishing relevant UK data. Per the last census (2020-21), about 16% of the UK is foreign-born.Learn More on the Voronoi App 
If you enjoyed today’s post, check out A Regional Breakdown of Europe’s Economy in 2025 (Adjusted for Living Costs) on Voronoi, the new app from Visual Capitalist.