Ranked: G20 Greenhouse Gas Emissions per Capita (1990–2024)
See visuals like this from many other data creators on our Voronoi app. Download it for free on iOS or Android and discover incredible data-driven charts from a variety of trusted sources.
Key Takeaways
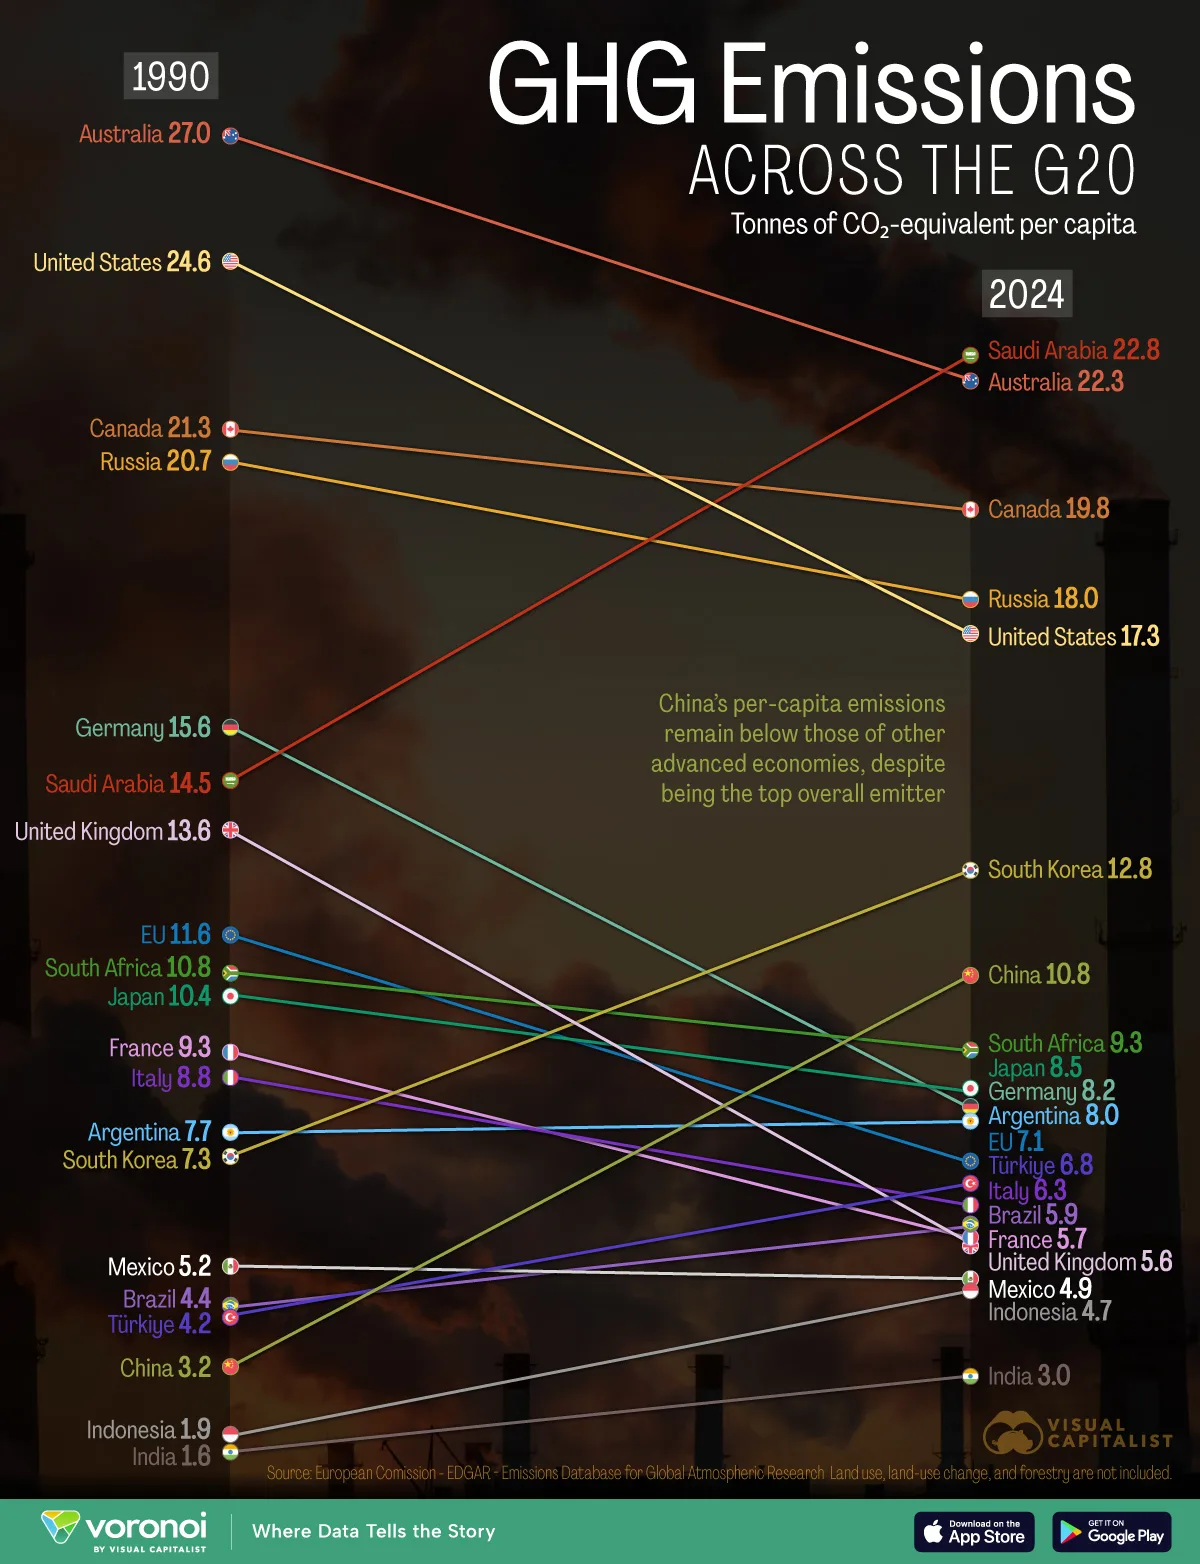
- China produces about 30% of global CO₂ emissions, but with its large population, its per-capita output (10.8 tonnes per person) remains below that of the U.S., Australia, and Canada.
- Countries including the UK, Germany, and France have cut emissions by 30–50% since 1990 thanks to the adoption of renewables.
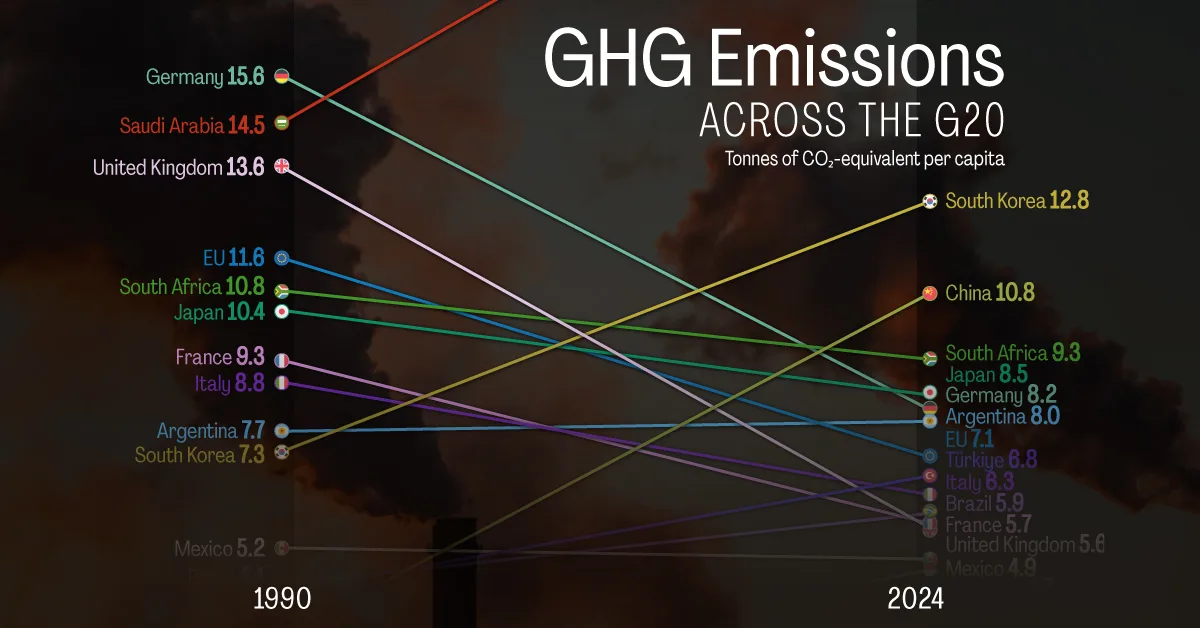
Greenhouse gas emissions have shifted across the world over the last three decades. The data for this visualization comes from the European Commission’s EDGAR database. It tracks greenhouse gas emissions per capita across the G20 from 1990 through 2024. The dataset accounts for CO₂-equivalent emissions in tonnes per capita. Land use, land-use change, and forestry are not included.
While fossil-fuel-dependent economies continue to rank high, advanced industrial economies in Europe have seen marked declines. Rapidly growing middle-income countries have increased their emissions but remain far below Western levels on a per-capita basis.
Saudi Arabia Tops the Ranking
Saudi Arabia (22.8 tonnes), Australia (22.3 tonnes), Canada (19.8 tonnes), and the United States (17.3 tonnes) remain among the highest per-capita emitters in 2024.
These levels reflect carbon-intensive power systems, large transportation footprints, and high consumption patterns. Russia, a big producer of fossil fuels, completes the top five with 18.02 tonnes per capita.
| Rank (2024) | Country (t CO2eq/cap) | 1990 | 2024 |
|---|---|---|---|
| 1 |  Saudi Arabia Saudi Arabia |
14.49 | 22.79 |
| 2 |  Australia Australia |
27.03 | 22.26 |
| 3 |  Canada Canada |
21.32 | 19.76 |
| 4 |  Russia Russia |
20.71 | 18.02 |
| 5 |  United States United States |
24.62 | 17.34 |
| 6 |  South Korea South Korea |
7.25 | 12.83 |
| 7 |  China China |
3.17 | 10.81 |
| 8 |  South Africa South Africa |
10.84 | 9.31 |
| 9 |  Japan Japan |
10.41 | 8.52 |
| 10 |  Germany Germany |
15.62 | 8.17 |
| 11 |  Argentina Argentina |
7.73 | 7.95 |
| 12 |  EU EU |
11.58 | 7.14 |
| 13 |  Türkiye Türkiye |
4.19 | 6.76 |
| 14 |  Italy Italy |
8.83 | 6.32 |
| 15 |  Brazil Brazil |
4.35 | 5.93 |
| 16 |  France France |
9.32 | 5.68 |
| 17 |  United Kingdom United Kingdom |
13.61 | 5.63 |
| 18 |  Mexico Mexico |
5.16 | 4.91 |
| 19 |  Indonesia Indonesia |
1.86 | 4.69 |
| 20 |  India India |
1.56 | 3.04 |
China and Emerging Economies Have Risen, but Still Lag Rich Countries
China’s per-capita emissions increased sharply, rising from 3.17 tonnes in 1990 to 10.81 tonnes in 2024.
Yet even at this level, it remains below the U.S., Canada, Australia, and Saudi Arabia. South Korea and Türkiye also saw significant increases as industrial output expanded. India and Indonesia remain among the lowest emitters on a per-person basis, despite rapid economic growth.
Europe and Japan Show the Steepest Long-Term Declines
Germany cut its per-capita emissions from 15.6 tonnes to 8.2 tonnes, while the UK saw an even larger drop—from 13.6 tonnes to 5.6 tonnes.
France, Italy, and the broader EU also show reductions of roughly 40–50% over the period. These declines reflect shifts toward renewable energy, energy-efficiency mandates, and broader economic transitions away from heavy industry. Japan followed a similar trend, falling from 10.4 tonnes to 8.5 tonnes.
Learn More on the Voronoi App 
If you enjoyed today’s post, check out Visualizing Future Solar Power Capacity by Country on Voronoi, the new app from Visual Capitalist.