How Global R&D Spending Growth Has Shifted Since 2000
See visuals like this from many other data creators on our Voronoi app. Download it for free on iOS or Android and discover incredible data-driven charts from a variety of trusted sources.
Key Takeaways
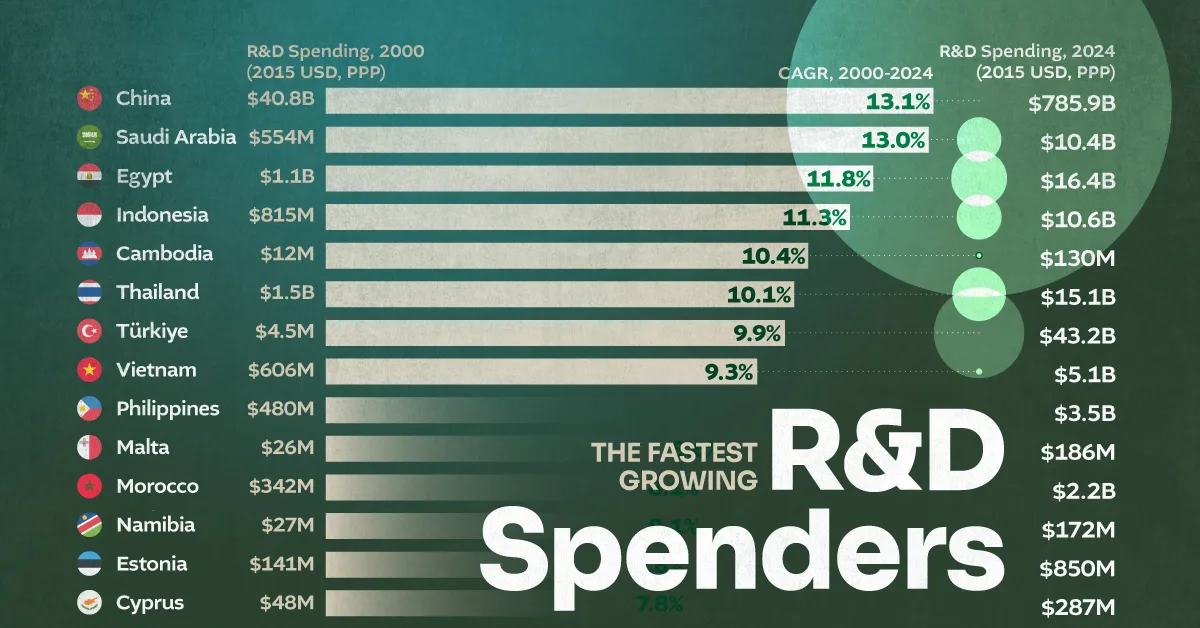
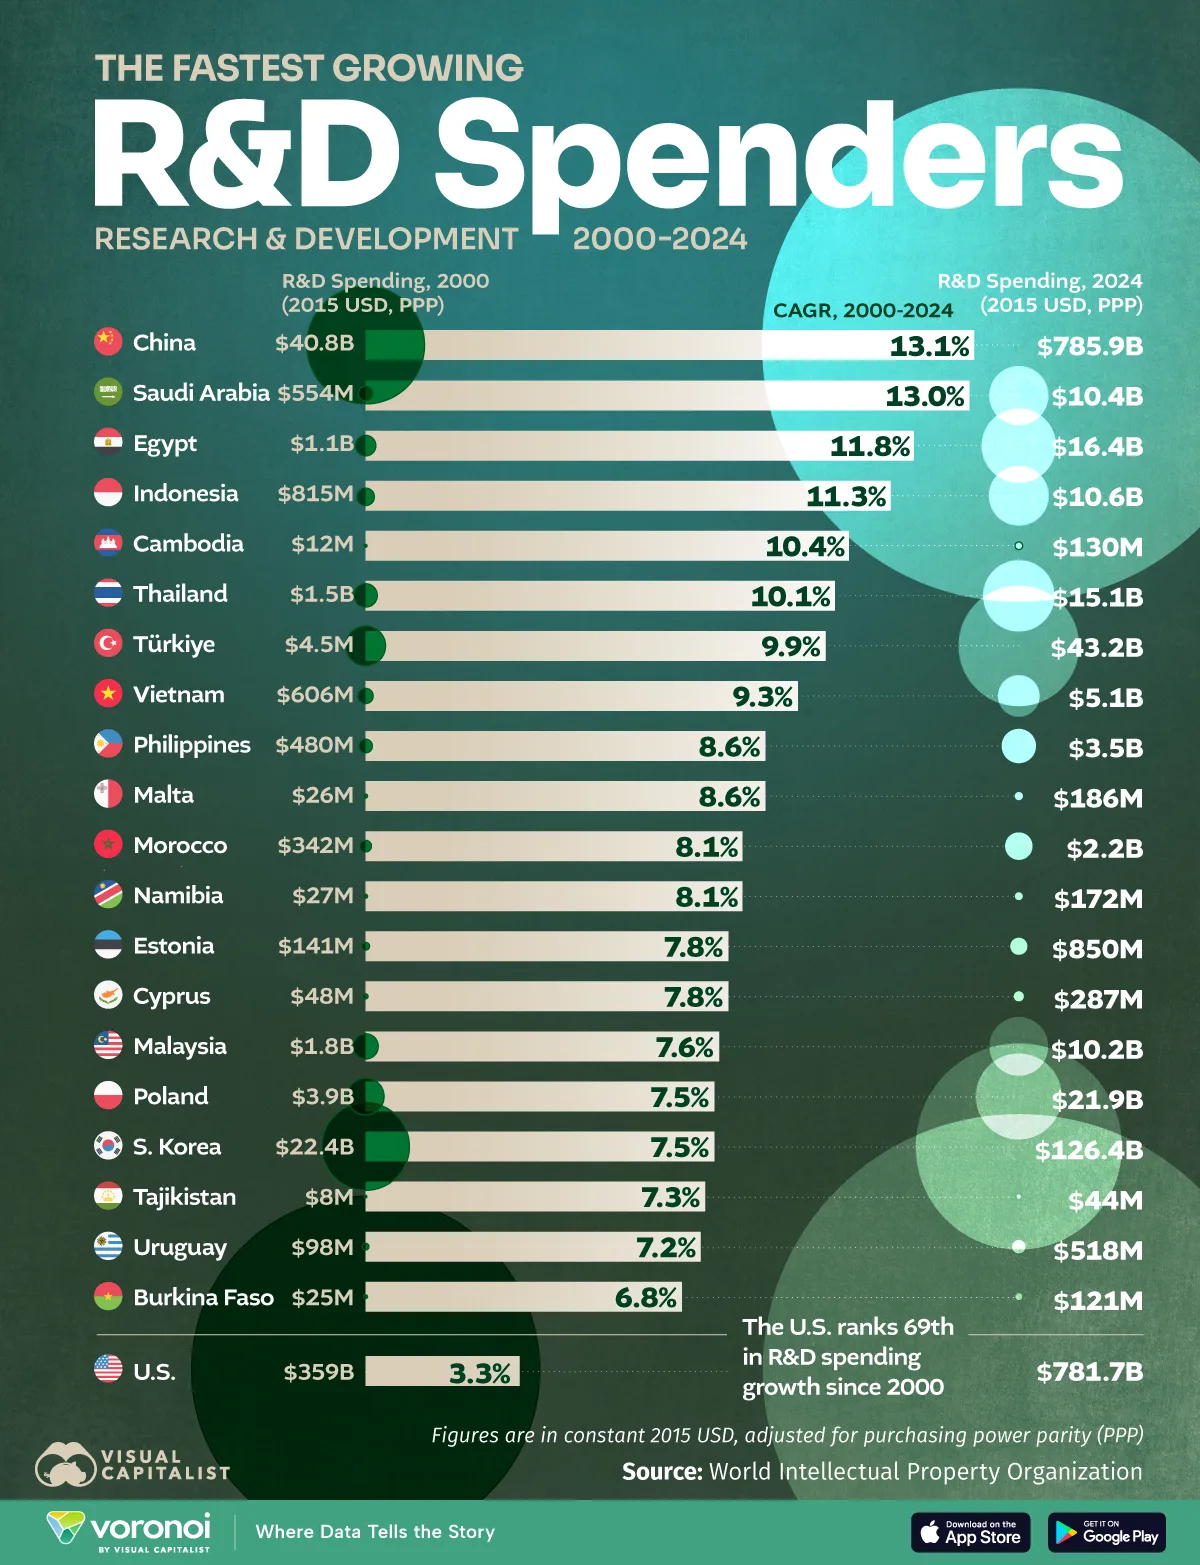
- China leads the world in R&D growth in percentage terms, with spending rising at a 13.1% compound annual rate since 2000.
- Several emerging economies, including Saudi Arabia, Egypt, and Indonesia, rank among the fastest-growing R&D spenders.
Over the past two decades, the world has become increasingly research-intensive, with global R&D spending reaching nearly $3 trillion in 2024, up from less than $1 trillion in the year 2000.
This visualization ranks the world’s fastest-growing R&D spenders based on the compound annual growth rate (CAGR) of gross R&D expenditure between 2000 and 2024, using data from the World Intellectual Property Organization (WIPO). All figures are in constant 2015 purchasing power parity (PPP)-adjusted U.S. dollars.
China Leads in Global R&D Spending
China tops the ranking, with R&D spending growing at a 13.1% annual rate since 2000. Over this period, China’s gross expenditure on R&D surged from just $40.8 billion in 2000 to nearly $786 billion in 2024, accounting for 27% of the global total.
The table below shows the top 20 economies with the fastest growth in R&D spending, along with their R&D outlays in 2000 and 2024:
| Rank | Economy | CAGR (2000–2024) | R&D Spend 2000 (USD, PPP 2015 billions) |
R&D Spend 2024 (USD, PPP 2015 billions) |
|---|---|---|---|---|
| 1 |  China China |
13.1% | $40.8 | $785.9 |
| 2 |  Saudi Arabia Saudi Arabia |
13.0% | $0.6 | $10.4 |
| 3 |  Egypt Egypt |
11.8% | $1.1 | $16.4 |
| 4 |  Indonesia Indonesia |
11.3% | $0.8 | $10.6 |
| 5 |  Cambodia Cambodia |
10.4% | $0.0 | $0.1 |
| 6 |  Thailand Thailand |
10.1% | $1.5 | $15.1 |
| 7 |  Türkiye Türkiye |
9.9% | $4.5 | $43.2 |
| 8 |  Vietnam Vietnam |
9.3% | $0.6 | $5.1 |
| 9 |  Philippines Philippines |
8.6% | $0.5 | $3.5 |
| 10 |  Malta Malta |
8.6% | $0.0 | $0.2 |
| 11 |  Morocco Morocco |
8.1% | $0.3 | $2.2 |
| 12 |  Namibia Namibia |
8.1% | $0.0 | $0.2 |
| 13 |  Estonia Estonia |
7.8% | $0.1 | $0.9 |
| 14 |  Cyprus Cyprus |
7.8% | $0.1 | $0.3 |
| 15 |  Malaysia Malaysia |
7.6% | $1.8 | $10.2 |
| 16 |  Poland Poland |
7.5% | $3.9 | $21.9 |
| 17 |  Republic of Korea Republic of Korea |
7.5% | $22.4 | $126.4 |
| 18 |  Tajikistan Tajikistan |
7.3% | $0.0 | $0.0 |
| 19 |  Uruguay Uruguay |
7.2% | $0.1 | $0.5 |
| 20 |  Burkina Faso Burkina Faso |
6.8% | $0.0 | $0.1 |
China’s rapid R&D expansion has positioned it as a global innovation powerhouse. Since 2000, China has accounted for more than 36% of all patent applications worldwide, and it also leads in AI patent filings globally.
Saudi Arabia ranks second, with R&D spending growing at 13% annually since 2000, the fastest rate among all high-income countries. Egypt follows closely behind, with R&D expenditure rising at an annual rate of nearly 12% from 2000 to 2024.
Several emerging economies, such as Indonesia, Thailand, and Vietnam, also rank among the fastest-growing R&D spenders, although their absolute spending remains relatively low.
Meanwhile, the U.S. (not on the list) is the world’s second-largest R&D spender in absolute terms, but American R&D expenditure has grown at just 3.3% annually from 2000 to 2024, placing it 69th worldwide.
Why R&D Growth Matters
Sustained investment in non-defense R&D positively correlates with higher total factor productivity over the long term, delivering spillover benefits in economic efficiency, manufacturing, and technological leadership.
Furthermore, countries that invest effectively in research are better positioned to develop advanced industries and attract skilled talent, especially as global competition revolves more around innovation than low-cost labor alone.
Learn More on the Voronoi App 
If you found this infographic interesting, explore more innovation and technology insights on Voronoi, including Who’s Winning the AI Patent Race?.