How the World’s Largest Economies Have Changed Since 2000
See visuals like this from many other data creators on our Voronoi app. Download it for free on iOS or Android and discover incredible data-driven charts from a variety of trusted sources.
Key Takeaways
- America has long held the title as the world’s largest economy, rising from a GDP of $10.3 trillion in 2000 to $30.6 trillion in 2025.
- China emerged as the second-biggest economy in 2010, with its economy growing by a factor of nearly 17 since the turn of the century.
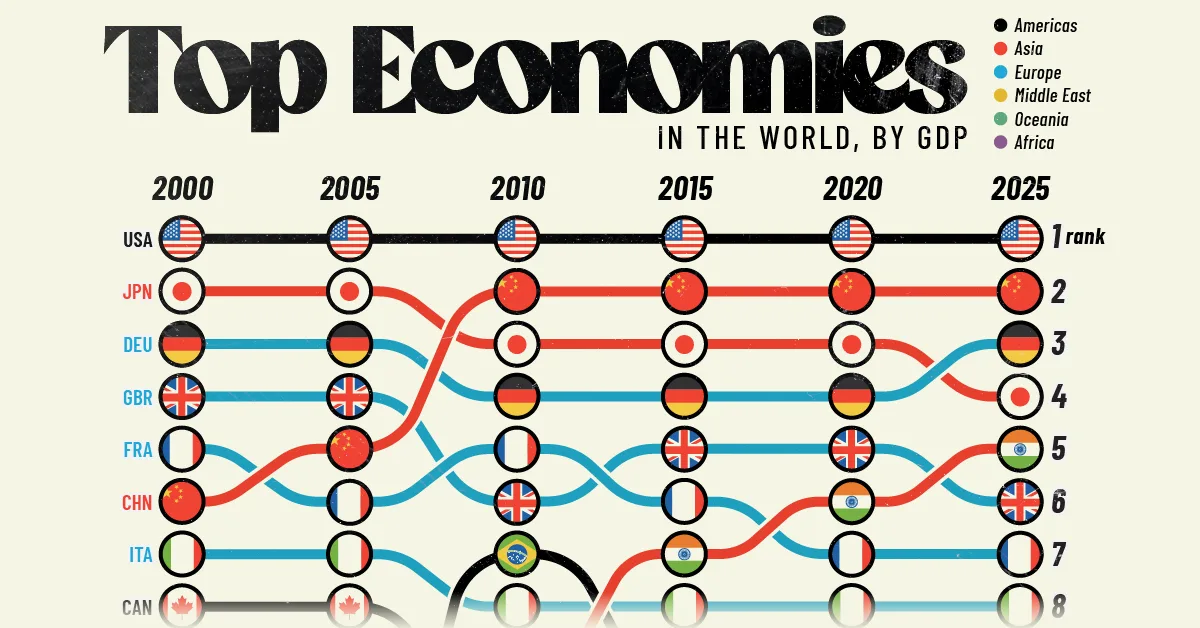
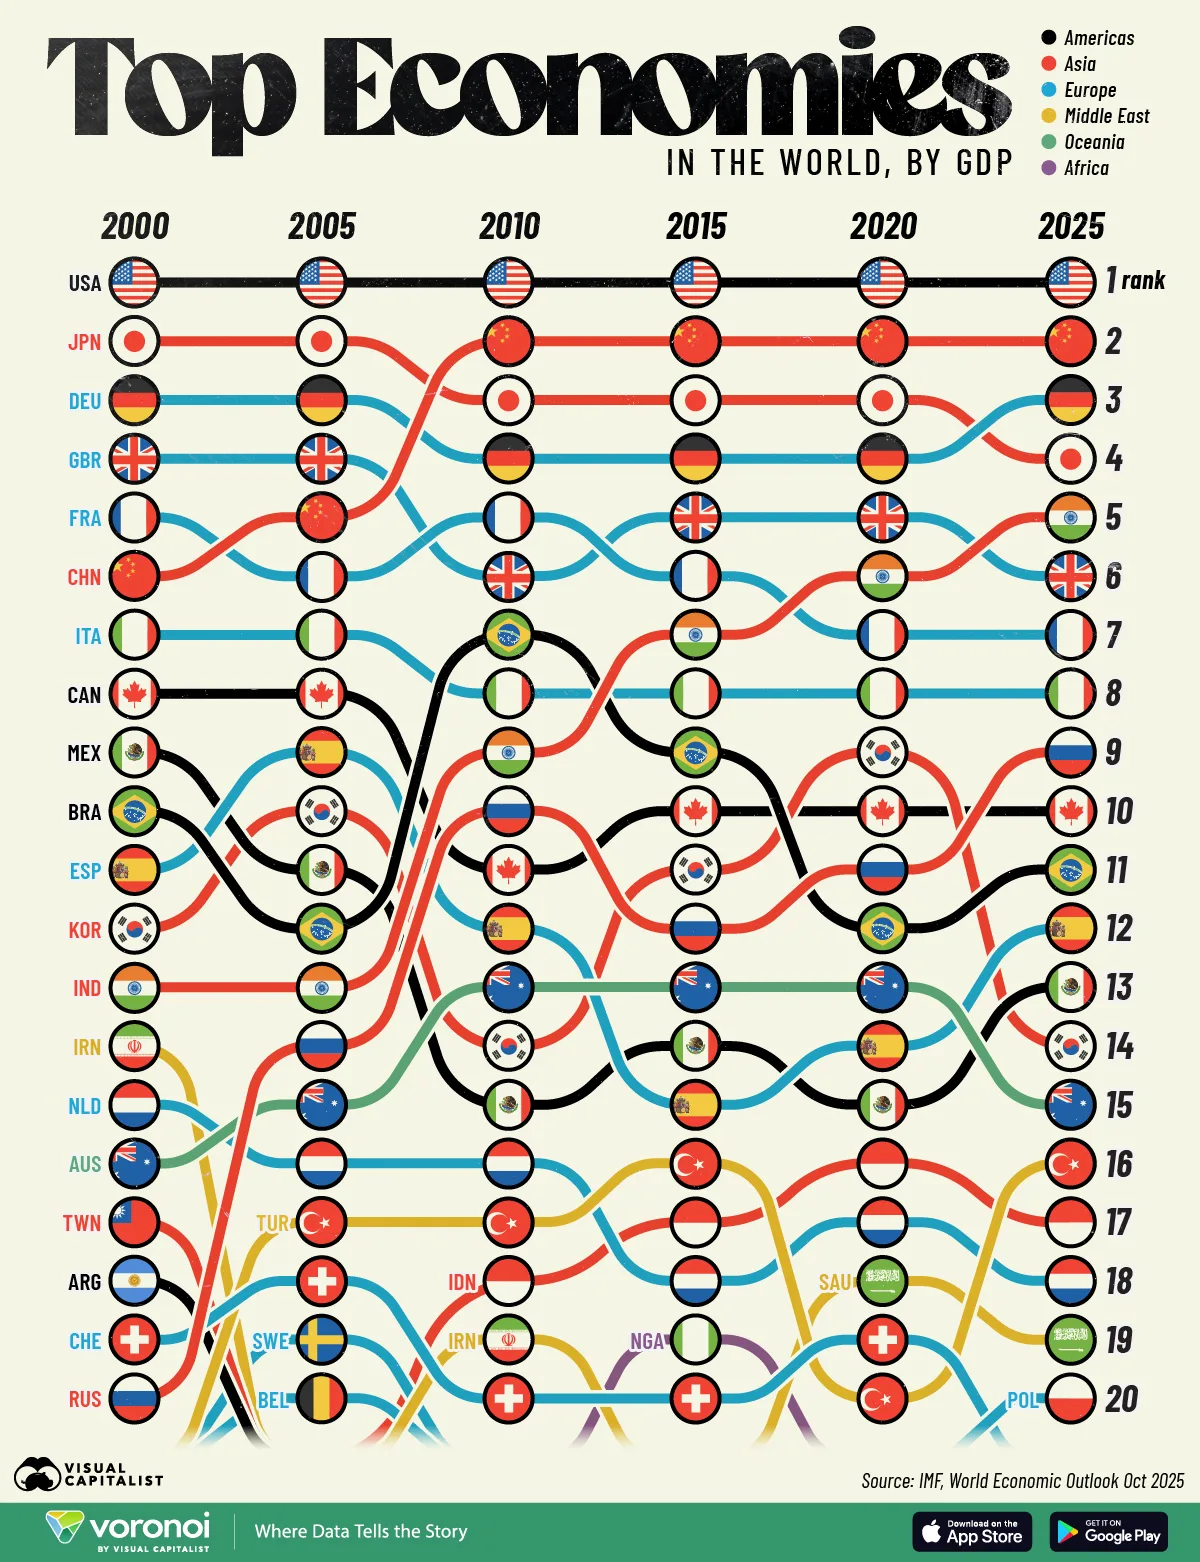
The global balance of power looks very different than it did 25 years ago.
In 2000, Japan was the world’s second-largest economy and China was only in sixth place. Since then, the global hierarchy has shifted dramatically, driven by the rapid rise of China and India.
This graphic shows the top economies by GDP over the past quarter century, based on data from the International Monetary Fund.
Then vs. Now: Comparing the World’s Top Economies by GDP
Here is how the top 20 ranking looked in 2000:
| 2000 Rank | Country | GDP (Nominal) |
|---|---|---|
| 1 |  U.S. U.S. |
$10.3T |
| 2 |  Japan Japan |
$5.0T |
| 3 |  Germany Germany |
$2.0T |
| 4 |  UK UK |
$1.7T |
| 5 |  France France |
$1.4T |
| 6 |  China China |
$1.2T |
| 7 |  Italy Italy |
$1.2T |
| 8 |  Canada Canada |
$0.7T |
| 9 |  Mexico Mexico |
$0.7T |
| 10 |  Brazil Brazil |
$0.7T |
| 11 |  Spain Spain |
$0.6T |
| 12 |  South Korea South Korea |
$0.6T |
| 13 |  India India |
$0.5T |
| 14 |  Iran Iran |
$0.4T |
| 15 |  Netherlands Netherlands |
$0.4T |
| 16 |  Australia Australia |
$0.4T |
| 17 |  Taiwan Taiwan |
$0.3T |
| 18 |  Argentina Argentina |
$0.3T |
| 19 |  Switzerland Switzerland |
$0.3T |
| 20 |  Russia Russia |
$0.3T |
And here’s how it changed, based on 2025 data:
| 2025 Rank | Country | GDP (Nominal) |
|---|---|---|
| 1 | U.S. |
$30.6T |
| 2 | China |
$19.4T |
| 3 | Germany |
$5.0T |
| 4 | Japan |
$4.3T |
| 5 | India |
$4.1T |
| 6 | UK |
$4.0T |
| 7 | France |
$3.4T |
| 8 | Italy |
$2.5T |
| 9 | Russia |
$2.5T |
| 10 | Canada |
$2.3T |
| 11 | Brazil |
$2.3T |
| 12 | Spain |
$1.9T |
| 13 | Mexico |
$1.9T |
| 14 | Korea, Republic of |
$1.9T |
| 15 | Australia |
$1.8T |
| 16 |  Türkiye Türkiye |
$1.6T |
| 17 |  Indonesia Indonesia |
$1.4T |
| 18 | Netherlands |
$1.3T |
| 19 |  Saudi Arabia Saudi Arabia |
$1.3T |
| 20 |  Poland Poland |
$1.0T |
For many decades, America has held its grip as the world’s largest economy, reaching $30.6 trillion of nominal GDP in 2025.
Over the past 25 years, U.S. GDP has nearly tripled, bolstered by its dominance in global financial markets and technology. Back in 2000, we can see it held a sizable lead over Japan, however, the country was overtaken by China in 2010.
With $19.4 trillion in GDP, China’s economy has grown from $1.2 trillion in 2000, a nearly seventeen-fold increase.
Similarly, India has seen a stunning rise in GDP over the 2000s. While it ranked as the 13th-largest economy by GDP in 2000, it has since climbed to fifth.
Moreover, India is projected to become the fourth-largest economy this year, thanks to robust GDP growth, favorable demographics, and substantial infrastructure investment.
Learn More on the Voronoi App 
To learn more about this topic, check out this graphic on economic power by region in 2025.