Ranked: Natural Gas Reserves by Country
See visuals like this from many other data creators on our Voronoi app. Download it for free on iOS or Android and discover incredible data-driven charts from a variety of trusted sources.
Key Takeaways
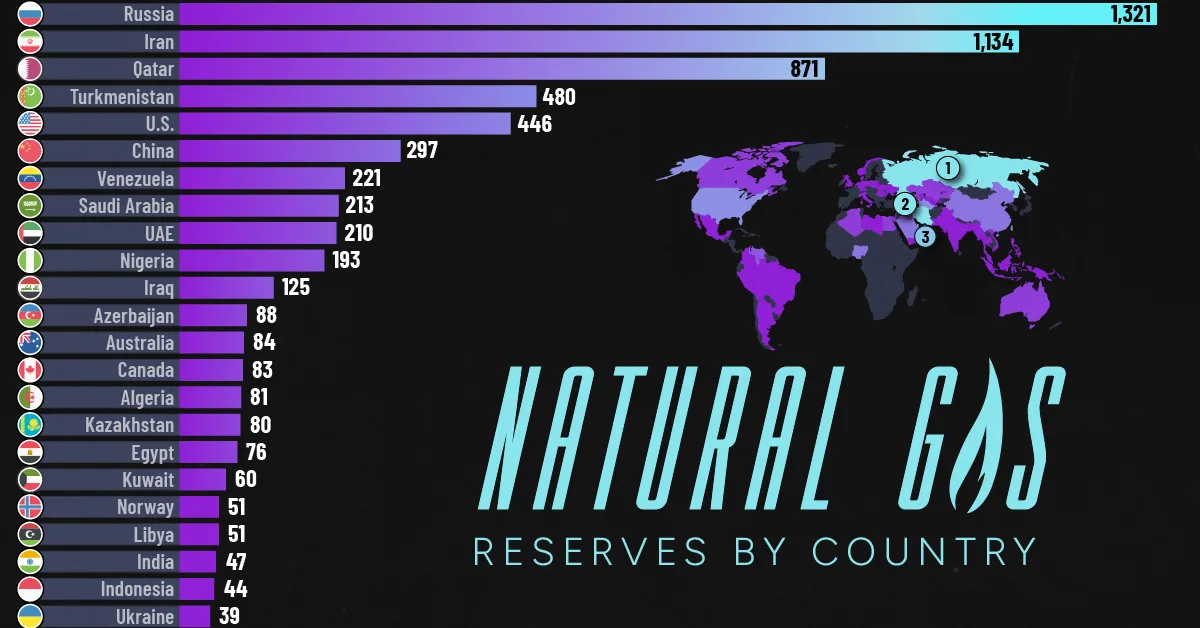
- Russia, Iran, and Qatar together hold more than half of the world’s proven natural gas reserves.
- Natural gas reserves are heavily concentrated in a small number of countries, shaping global energy and geopolitics.
Natural gas plays a critical role in the global energy system, powering electricity generation, heating homes, and supporting industrial activity. Despite its widespread use, the world’s natural gas reserves are highly unevenly distributed.
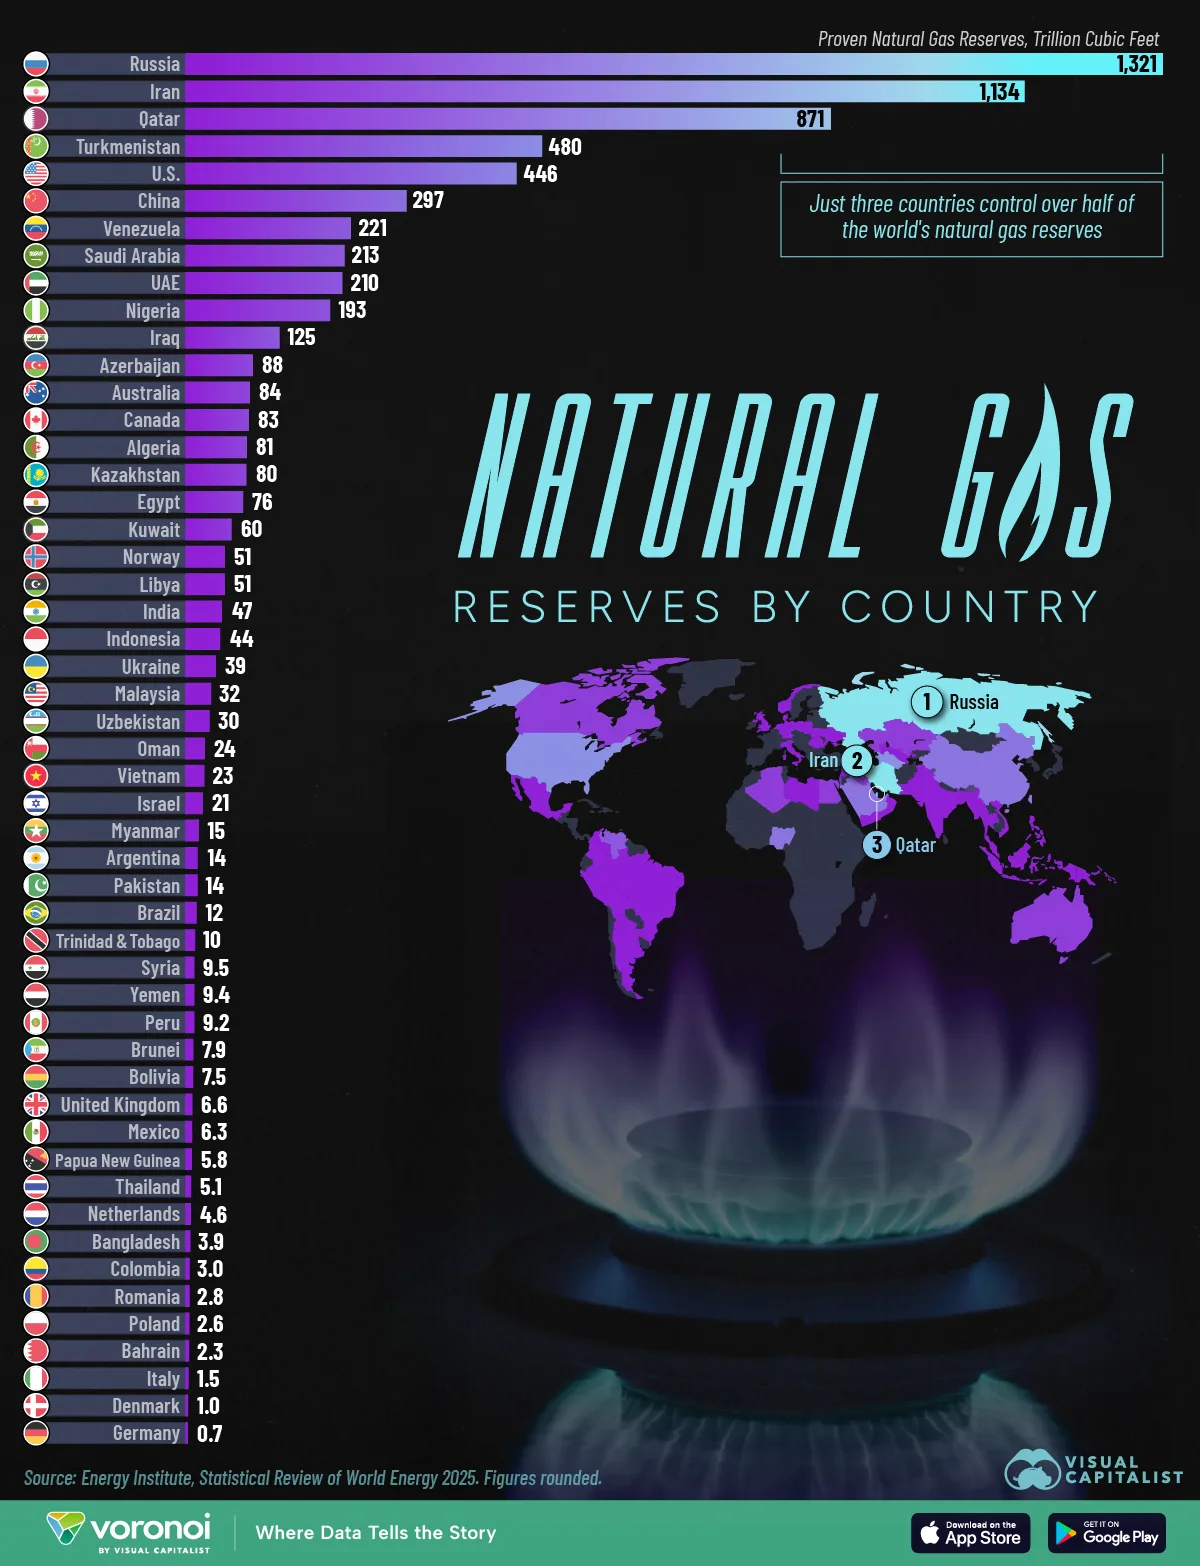
This visualization ranks countries by their proven natural gas reserves, measured in trillion cubic feet. The data for this visualization comes from the Energy Institute’s Statistical Review of World Energy 2025.
A Handful of Countries Dominate Global Reserves
Just three countries—Russia, Iran, and Qatar—control over half of the world’s proven natural gas reserves. Russia alone holds more than 1,300 trillion cubic feet, giving it the largest national stockpile globally.
| Rank | Country | Natural Gas Reserves (Tcf) |
|---|---|---|
| 1 |  Russian Federation Russian Federation |
1,320.5 |
| 2 |  Iran Iran |
1,133.6 |
| 3 |  Qatar Qatar |
871.1 |
| 4 |  Turkmenistan Turkmenistan |
480.3 |
| 5 |  United States United States |
445.6 |
| 6 |  China China |
296.6 |
| 7 |  Venezuela Venezuela |
221.1 |
| 8 |  Saudi Arabia Saudi Arabia |
212.6 |
| 9 |  United Arab Emirates United Arab Emirates |
209.7 |
| 10 |  Nigeria Nigeria |
193.3 |
| 11 |  Iraq Iraq |
124.6 |
| 12 |  Azerbaijan Azerbaijan |
88.4 |
| 13 |  Australia Australia |
84.4 |
| 14 |  Canada Canada |
83.1 |
| 15 |  Algeria Algeria |
80.5 |
| 16 |  Kazakhstan Kazakhstan |
79.7 |
| 17 |  Egypt Egypt |
75.5 |
| 18 |  Kuwait Kuwait |
59.9 |
| 19 |  Norway Norway |
50.5 |
| 20 |  Libya Libya |
50.5 |
| 21 |  India India |
46.6 |
| 22 |  Indonesia Indonesia |
44.2 |
| 23 |  Ukraine Ukraine |
38.5 |
| 24 |  Malaysia Malaysia |
32.1 |
| 25 |  Uzbekistan Uzbekistan |
29.9 |
| 26 |  Oman Oman |
23.5 |
| 27 |  Vietnam Vietnam |
22.8 |
| 28 |  Israel Israel |
20.8 |
| 29 |  Myanmar Myanmar |
15.3 |
| 30 |  Argentina Argentina |
13.6 |
| 31 |  Pakistan Pakistan |
13.6 |
| 32 |  Brazil Brazil |
12.3 |
| 33 |  Trinidad & Tobago Trinidad & Tobago |
10.2 |
| 34 |  Syria Syria |
9.5 |
| 35 |  Yemen Yemen |
9.4 |
| 36 |  Peru Peru |
9.2 |
| 37 |  Brunei Brunei |
7.9 |
| 38 |  Bolivia Bolivia |
7.5 |
| 39 |  United Kingdom United Kingdom |
6.6 |
| 40 |  Mexico Mexico |
6.3 |
| 41 |  Papua New Guinea Papua New Guinea |
5.8 |
| 42 |  Thailand Thailand |
5.1 |
| 43 |  Netherlands Netherlands |
4.6 |
| 44 |  Bangladesh Bangladesh |
3.9 |
| 45 |  Colombia Colombia |
3.0 |
| 46 |  Romania Romania |
2.8 |
| 47 |  Poland Poland |
2.6 |
| 48 |  Bahrain Bahrain |
2.3 |
| 49 |  Italy Italy |
1.5 |
| 50 |  Denmark Denmark |
1.0 |
| 51 |  Germany Germany |
0.7 |
Before Russia’s 2022 invasion of Ukraine, around 40–45% of EU gas imports came from Russia, but that share has since fallen to around 13–19% as of mid-2025.
The Middle East and Eurasia Lead
Beyond the top three, countries such as Turkmenistan, Saudi Arabia, the United Arab Emirates, and Iraq add to the Middle East and Central Asia’s strong position in global gas reserves.
These regions benefit from vast, low-cost reserves that can support long-term production, making them central players in global liquefied natural gas (LNG) exports.
The United States and China Among Top Holders
The United States ranks fifth globally, with roughly 446 trillion cubic feet in reserves, reflecting the impact of shale gas development over the past two decades.
China also appears among the top holders, though its domestic demand is so large that it remains heavily dependent on imports despite sizable reserves.
Smaller Producers Still Matter Regionally
Countries with more modest reserves—including Norway, the United Kingdom, and the Netherlands—continue to play important regional roles due to existing infrastructure and proximity to major demand centers.
However, declining reserves in parts of Europe underscore the continent’s growing reliance on imports.
Learn More on the Voronoi App 
If you enjoyed today’s post, check out Global Energy Demand by Fuel Type (2024-2050P) on Voronoi, the new app from Visual Capitalist.