Ranked: Nuclear Power Capacity by Country (2025)
This was originally posted on our Voronoi app. Download the app for free on iOS or Android and discover incredible data-driven charts from a variety of trusted sources.
Key Takeaways
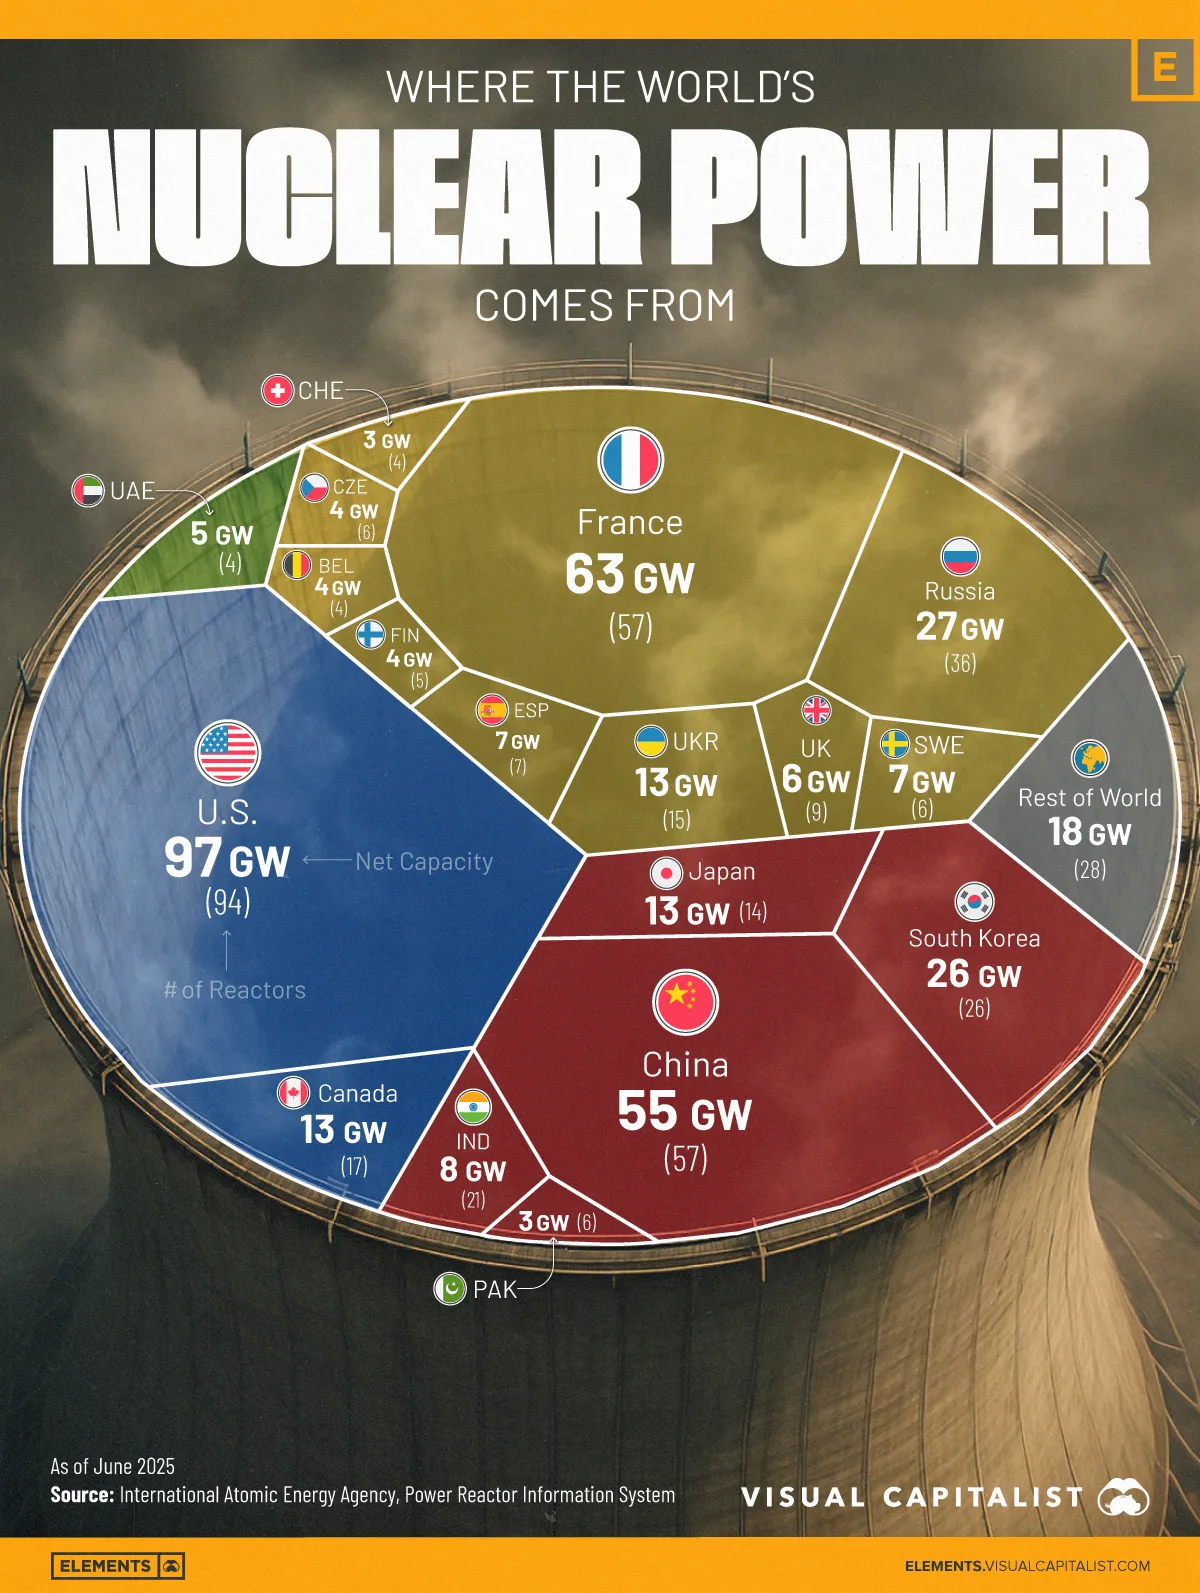
- Five countries account for 71% of the world’s nuclear generation capacity.
- The United States leads with 97 gigawatt (GW) across 94 reactors; France and China both run 57 reactors, but France’s capacity is higher at 63 GW.
Nuclear power supplies a steady source of low-carbon electricity across many grids. Yet the bulk of capacity is concentrated in a handful of countries. This chart breaks down where global nuclear capacity sits today. The data for this visualization comes from the International Atomic Energy Agency’s Power Reactor Information System (PRIS).
The Big Five Dominate Global Capacity
Five countries account for 71% of global nuclear capacity.
The United States tops the list with 97 GW across 94 reactors. France ranks second at 63 GW, a result of its historic policy to standardize and scale nuclear after the 1970s oil shocks. China follows at 55 GW. Russia (27 GW) and South Korea (26 GW) round out the top five.
| Country | Net Capacity (GW) | Number of Reactors |
|---|---|---|
| 97 | 94 | |
| 63 | 57 | |
| 55 | 57 | |
| 27 | 36 | |
| 26 | 26 | |
| 13 | 15 | |
| 13 | 17 | |
| 13 | 14 | |
| 8 | 21 | |
| 7 | 7 | |
| 7 | 6 | |
| 6 | 9 | |
| 5 | 4 | |
| 4 | 5 | |
| 4 | 6 | |
| 4 | 4 | |
| 3 | 6 | |
| 3 | 4 | |
| 18 | 28 |
Reactor Count vs. Reactor Scale
France and China both operate 57 reactors, yet France’s capacity is higher at 63 GW versus China’s 55 GW. The gap points to average reactor size, capacity uprates, and fleet composition. France’s standardized designs and efficiency upgrades push more net output per unit. China’s fleet includes a mix of older and newer designs, with several units commissioned in the past decade.
However, as China ramps larger Gen III+ reactors, this capacity differential could narrow quickly. Currently, nearly half of the world’s nuclear power under construction is located in China.
Emerging Players
Emerging players are also reshaping the nuclear map: the United Arab Emirates has reached 5 GW with just four reactors, while Finland and the U.K. maintain smaller but strategic fleets. Similarly, India has steadily expanded its nuclear capacity over recent decades, operating 21 reactors with a combined net capacity of 9 GW.
Learn More on the Voronoi App 
If you enjoyed today’s post, check out Where is the Most Natural Gas Production? on Voronoi, the new app from Visual Capitalist.


