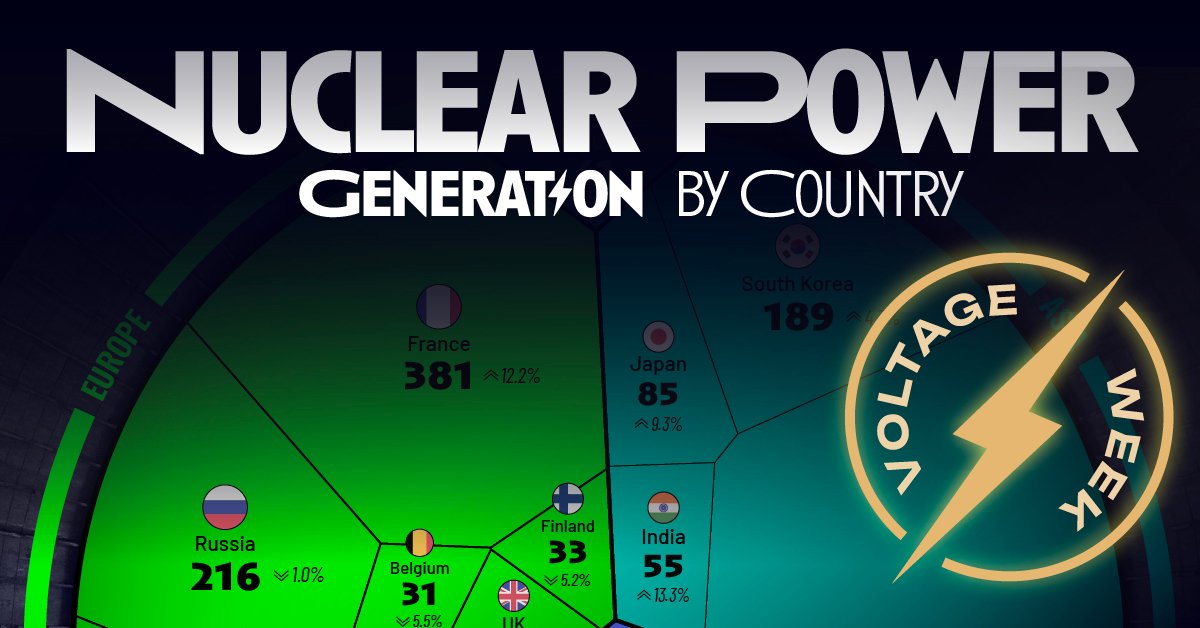
Ranked: Nuclear Power Generation by Country
This was originally posted on our Voronoi app. Download the app for free on iOS or Android and discover incredible data-driven charts from a variety of trusted sources.
Key Takeaways
- The U.S. accounts for nearly 30% of global nuclear power generation.
- China is the second-largest producer, followed by France.
- Globally, nuclear power accounts for 10% of total electricity generation.
Nuclear power remains one of the world’s largest sources of low-carbon electricity, providing reliable baseload energy for millions of people.
In 2024, global nuclear power plants generated 2,818 terawatt-hours (TWh) of electricity, accounting for roughly 10% of the world’s total electricity generation.
This visualization is part of Visual Capitalist’s VOLTage Week, sponsored by Tema ETFs. It breaks down nuclear power generation by country, highlighting the biggest producers of nuclear energy, using data from the Energy Institute’s Statistical Review of World Energy.
The World’s Largest Nuclear Power Producers
Below is the ranking of the top nuclear power-generating countries in 2024, along with their share of the global total:
| Rank | Country | Nuclear Energy Generation (TWh) | Share of Total |
|---|---|---|---|
| 1 |  U.S. U.S. |
823 | 29.2% |
| 2 |  China China |
451 | 16.0% |
| 3 |  France France |
381 | 13.5% |
| 4 |  Russia Russia |
216 | 7.7% |
| 5 |  South Korea South Korea |
189 | 6.7% |
| 6 |  Canada Canada |
86 | 3.0% |
| 7 |  Japan Japan |
85 | 3.0% |
| 8 |  India India |
55 | 1.9% |
| 9 |  Spain Spain |
55 | 1.9% |
| 10 |  Ukraine Ukraine |
53 | 1.9% |
| 11 |  Sweden Sweden |
51 | 1.8% |
| 12 |  United Kingdom United Kingdom |
41 | 1.4% |
| 13 |  United Arab Emirates United Arab Emirates |
41 | 1.4% |
| 14 |  Finland Finland |
33 | 1.2% |
| 15 |  Belgium Belgium |
31 | 1.1% |
 Rest of world Rest of world |
230 | 8.2% | |
| n/a |  Total World Total World |
2,818 | 100% |
The United States remains the clear leader, generating nearly 30% of the world’s nuclear electricity, equivalent to the next two countries combined. Despite no new large-scale reactors coming online in decades, high capacity factors and life extensions for existing plants have kept U.S. nuclear energy production steady.
China has rapidly risen to second place as it continues to expand its fleet of reactors, with multiple new units under construction.
France, where over 60% of electricity comes from nuclear, saw the largest year-over-year growth among the top five producers in 2024 (+12.2%).
Meanwhile, Russia—the fourth-largest nuclear power producer—experienced a slight decline in nuclear power generation (-1.0%) in 2024. Canada, Spain, and Finland all posted modest drops, largely due to scheduled outages or load adjustments in their grids.
On the other hand, India saw the largest increase in nuclear power production in 2024, growing by over 13% from 2023 levels.
The World’s Aging Nuclear Reactor Fleet
As of 2025, there are 416 operating nuclear reactors worldwide, and around two-thirds of these are more than 30 years old. Nuclear reactors are typically designed to operate for 40–50 years, although they can operate for longer with lifetime extensions.
Although the currently operating fleet is aging, more than 60 new reactors have commenced operations in the last 10 years. Furthermore, around 70 new reactors are currently under construction across 15 countries, brightening the outlook for the world’s reactor fleet.
Learn More on the Voronoi App 
If you enjoyed today’s post, check out How the EU Generates its Electricity in 2025 on Voronoi, the app from Visual Capitalist.


