

Ranked: P/E Ratios in Emerging vs. Developed Markets
Key Takeaways
- Emerging market stocks trade at P/E ratios over 30% lower than developed markets, and more than 40% lower than U.S. equities.
- Singaporean stocks have the lowest price-to-earnings (P/E) ratio: 15.3.
- New Zealand stocks have the highest P/E ratio: 101.4
Emerging Markets (EMs) often offer attractive stock valuations, with lower price-to-earning ratios (P/E ratios) that may still deliver strong returns for investors.
In this graphic, the third and final in the EMs Series, Visual Capitalist has partnered with Global X ETFs to explore the P/E ratios of Emerging and Developed Markets.
P/E Ratios
The P/E ratio is among investors’ most common metrics for evaluating investment viability. These ratios compare a company’s current stock price to its earnings per share.
Below is a ranking of 10 markets by their P/E ratio, provided by MSCI:
| Rank | Country/Region | P/E Ratio |
|---|---|---|
| 1 | Singapore | 15.3 |
| 2 | Europe & UK | 15.9 |
| 3 | Emerging Markets ex China | 15.9 |
| 4 | Japan | 16.2 |
| 5 | Hong Kong | 16.2 |
| 6 | Canada | 20.2 |
| 7 | Australia | 20.2 |
| 8 | Developed Markets | 23.2 |
| 9 | U.S. | 27.5 |
| 10 | New Zealand | 101.4 |
Essentially, it shows how much investors will pay for each dollar of a company’s earnings. Investors can also extrapolate this ratio to gain the P/E ratios of all companies in a country.
Undervalued Emerging Markets
Trailing P/E ratios can help investors assess if stocks or indexes are overvalued (higher P/E) or undervalued (lower P/E).
Singapore, for example, has the lowest P/E ratio, 15.3, which means that Singaporean companies are likely undervalued compared to their earnings. New Zealand, on the other hand, has the highest P/E ratio, over three times greater than the U.S. P/E ratio–101.4.*
*as of 06/30/2025
EM (excluding China) stocks are generally undervalued compared to their earnings, with their stock prices being around 30% cheaper than their contemporaries in Developed Markets and 40% cheaper than U.S. stocks.
Unlocking Frontier Opportunities
EMs offer attractive valuations compared to their Developed Market counterparts, potentially presenting a compelling opportunity for investors.
Are you interested in exploring the dynamic Emerging Markets landscape?
The Global X Emerging Markets ex-China ETF (EMM) seeks to invest in companies, excluding those in China, that can achieve or maintain a dominant position within their respective markets.

Learn more about the Global X Emerging Markets ex-China ETF (EMM).
-
 Economy2 hours ago
Charted: Foreign Direct Investment in Emerging Markets
Emerging Markets drew $430B in foreign direct investment in 2022, outpacing global growth. How have these trends evolved over time?
-
 Economy4 hours ago
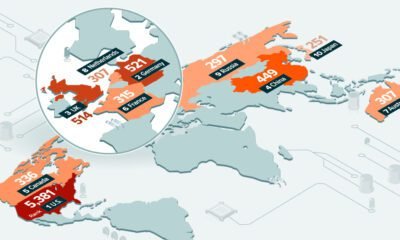
Mapped: Population of Emerging Markets
Emerging Markets are countries transitioning from developing to developed status. How significant are they in terms of global population?
-
 Markets1 month ago
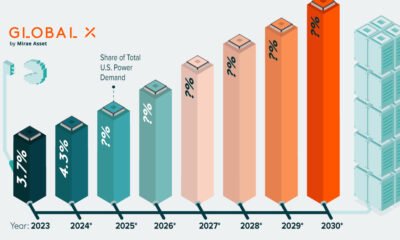
Charted: The Rising Share of U.S. Data Center Power Demand
As advanced AI adoption surges, U.S. data center demand is projected to reach nearly 12% of the nation’s power.
-
 Markets1 month ago
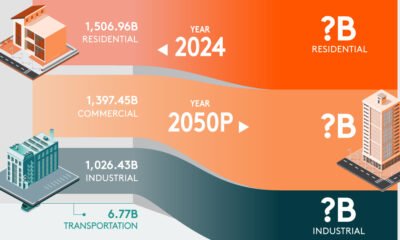
What’s Driving America’s Growing Electricity Demand?
The U.S. EIA believes that by 2050, U.S. power demand will surge by nearly 50%.
-
 Energy2 months ago
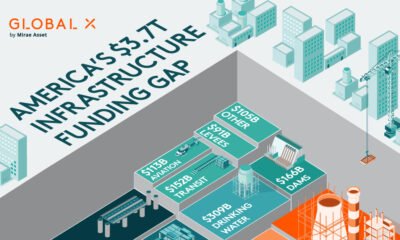
Breaking Down America’s $3.7 Trillion Infrastructure Funding Gap
Despite many government efforts to modernize U.S. infrastructure, the funding gap stood at a staggering $3.7 trillion in 2025.
-

 Politics4 months ago
Breaking Down the West’s $146 Billion 2024 Defence Technology Investment
Visual Capitalist has partnered with Global X ETFs to break down the $146 billion spent on defence technology by the U.S. and the EU.
-

 Politics4 months ago
Mapped: How NATO Defence Spending Has Changed Since the Ukraine-Russia War
Visual Capitalist has partnered with Global X ETFs to explore how NATO defence spending has changed since the start of the Ukrain-Russia war.
-
 Politics4 months ago
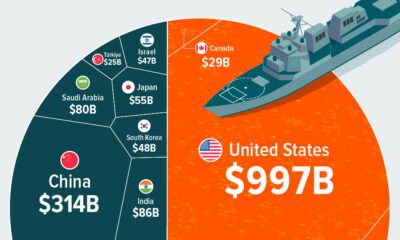
Visualized: Global Defence Spending in 2024
Visual Capitalist has partnered with Global X ETFs to explore global defence spending and find out which nation spends the most on defence.
-
 Economy5 months ago
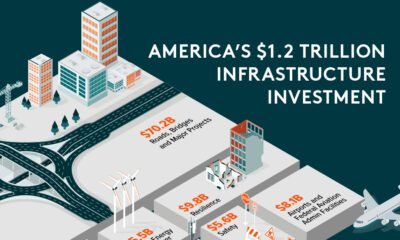
Breaking Down the 117th Congress’s $1.2T Infrastructure Investment
Graphic showing U.S. infrastructure investment highlighting that investment is primarily going to roads, bridges, and other major projects.
-

 Economy5 months ago
Report Card: Grading U.S. Infrastructure
This graphic shows U.S infrastructure grades and highlights the general low grade.
-
 Energy10 months ago
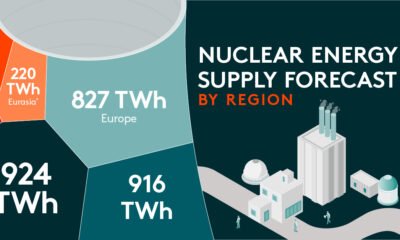
Nuclear Energy Supply Forecast by Region
Visual Capitalist and Global X partnered to explore global nuclear energy demand, and how it’s changing, in the coming years.
-
 Energy10 months ago
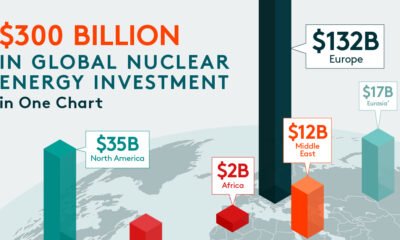
Charted: $300 Billion in Global Nuclear Energy Investment
Visual Capitalist and Global X partnered to explore nuclear energy investment and find out which regions spent the most on nuclear power.
-
 Energy10 months ago
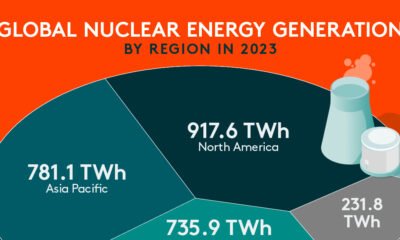
Visualized: Nuclear Energy Generation by Region
Visual Capitalist and Global X ETFs explore regional nuclear energy generation and why nuclear energy is critical to the energy transition.
-
 Technology12 months ago
Ranked: Which Countries Have the Most Data Centers?
For this graphic, Visual Capitalist partnered with Global X ETFs to rank the nations by the number of data centers they currently operate.
-

 Technology12 months ago
Charted: How Much Data is Stored Online?
For this graphic, Visual Capitalist has partnered with Global X ETFs to explore online data generation and show how much data could be generated between 2015…
-
 Technology12 months ago
Visualized: The Impact of AI on Revenue
In this graphic, Visual Capitalist has partnered with Global X ETFs to explore the financial impact of AI adoption across various industries.
-

 Green2 years ago
Mapped: U.S. Investment in Sustainable Infrastructure (2021-2023)
This graphic shows high levels of investment in U.S. clean infrastructure between 2021 and 2023.
-

 Technology2 years ago
Visualized: What is the Artificial Intelligence of Things?
Explore the explosive growth of the Artificial Intelligence of Things (AIoT) industry and its transformative impact across sectors.
-

 Technology2 years ago
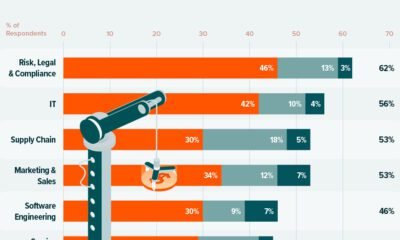
A Visual Guide to AI Adoption, by Industry
AI adoption impacts many industries, with finance leading. Discover how AI tools optimize operations, mitigate risks, and drive growth.
-
 Technology2 years ago
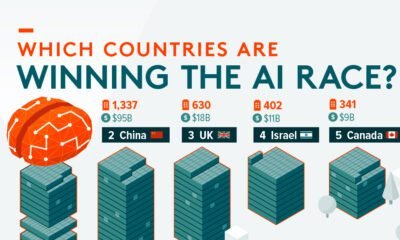
Ranked: Artificial Intelligence Startups, by Country
Find out which countries are winning the race when it comes to the number of AI startups and private investment .
-
 Technology3 years ago
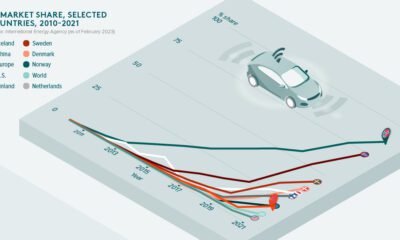
On the Road to Electric Vehicles
Electric vehicles are playing a key role in the decarbonization of road transport. But how much further do we need to go to hit net zero?
-

 Mining3 years ago
Should You Invest in Disruptive Materials?
Disruptive materials are experiencing a demand supercycle. See how these materials are helping revolutionize next generation technologies.
-
 Technology3 years ago
Thematic Investing: 3 Key Trends in Cybersecurity
Cyberattacks are becoming more frequent and sophisticated. Here’s what investors need to know about the future of cybersecurity.