Ranked: The Cost of Utilities Around the World
See visuals like this from many other data creators on our Voronoi app. Download it for free on iOS or Android and discover incredible data-driven charts from a variety of trusted sources.
Key Takeaways
- In Munich, Germany households pay on average $404 a month for utilities, up nearly 40% since 2020.
- San Francisco has the highest utility costs in America, where prices are a fifth higher than in New York City.
Since 2020, the cost of utilities has more than doubled across some European cities, putting strain on households, businesses, and manufacturers.
In Warsaw, Poland the average monthly cost of basic utilities stands at $357—up from $176 in 2020. Meanwhile, several struggling businesses in the UK closed amid shy-high utilities costs due to the Russia-Ukraine war.
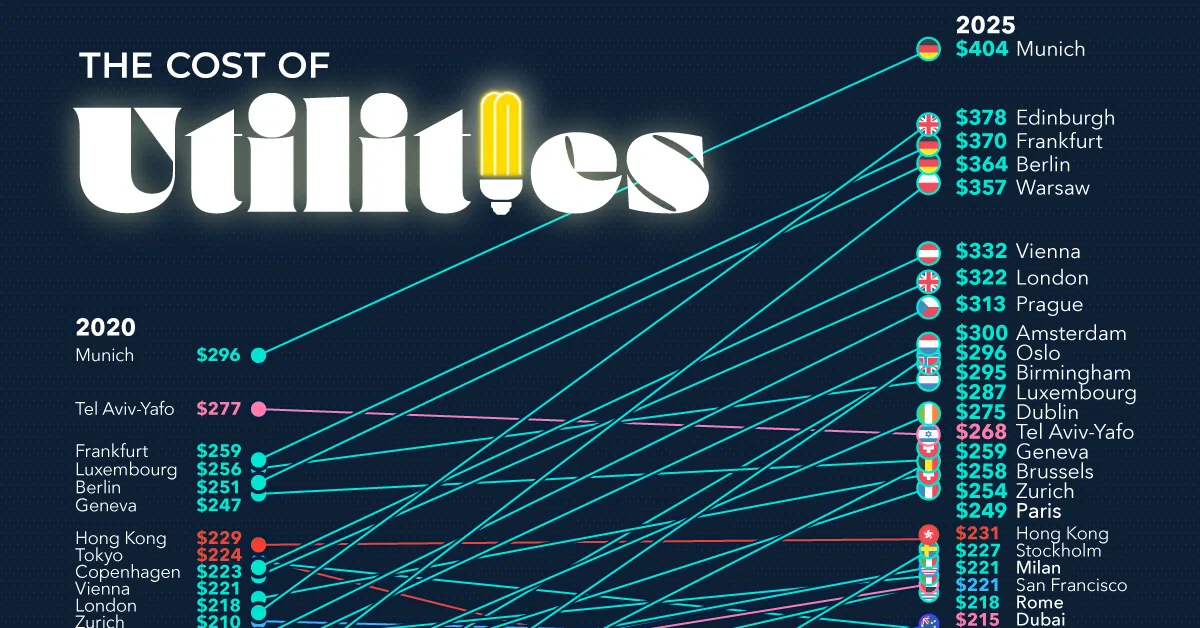
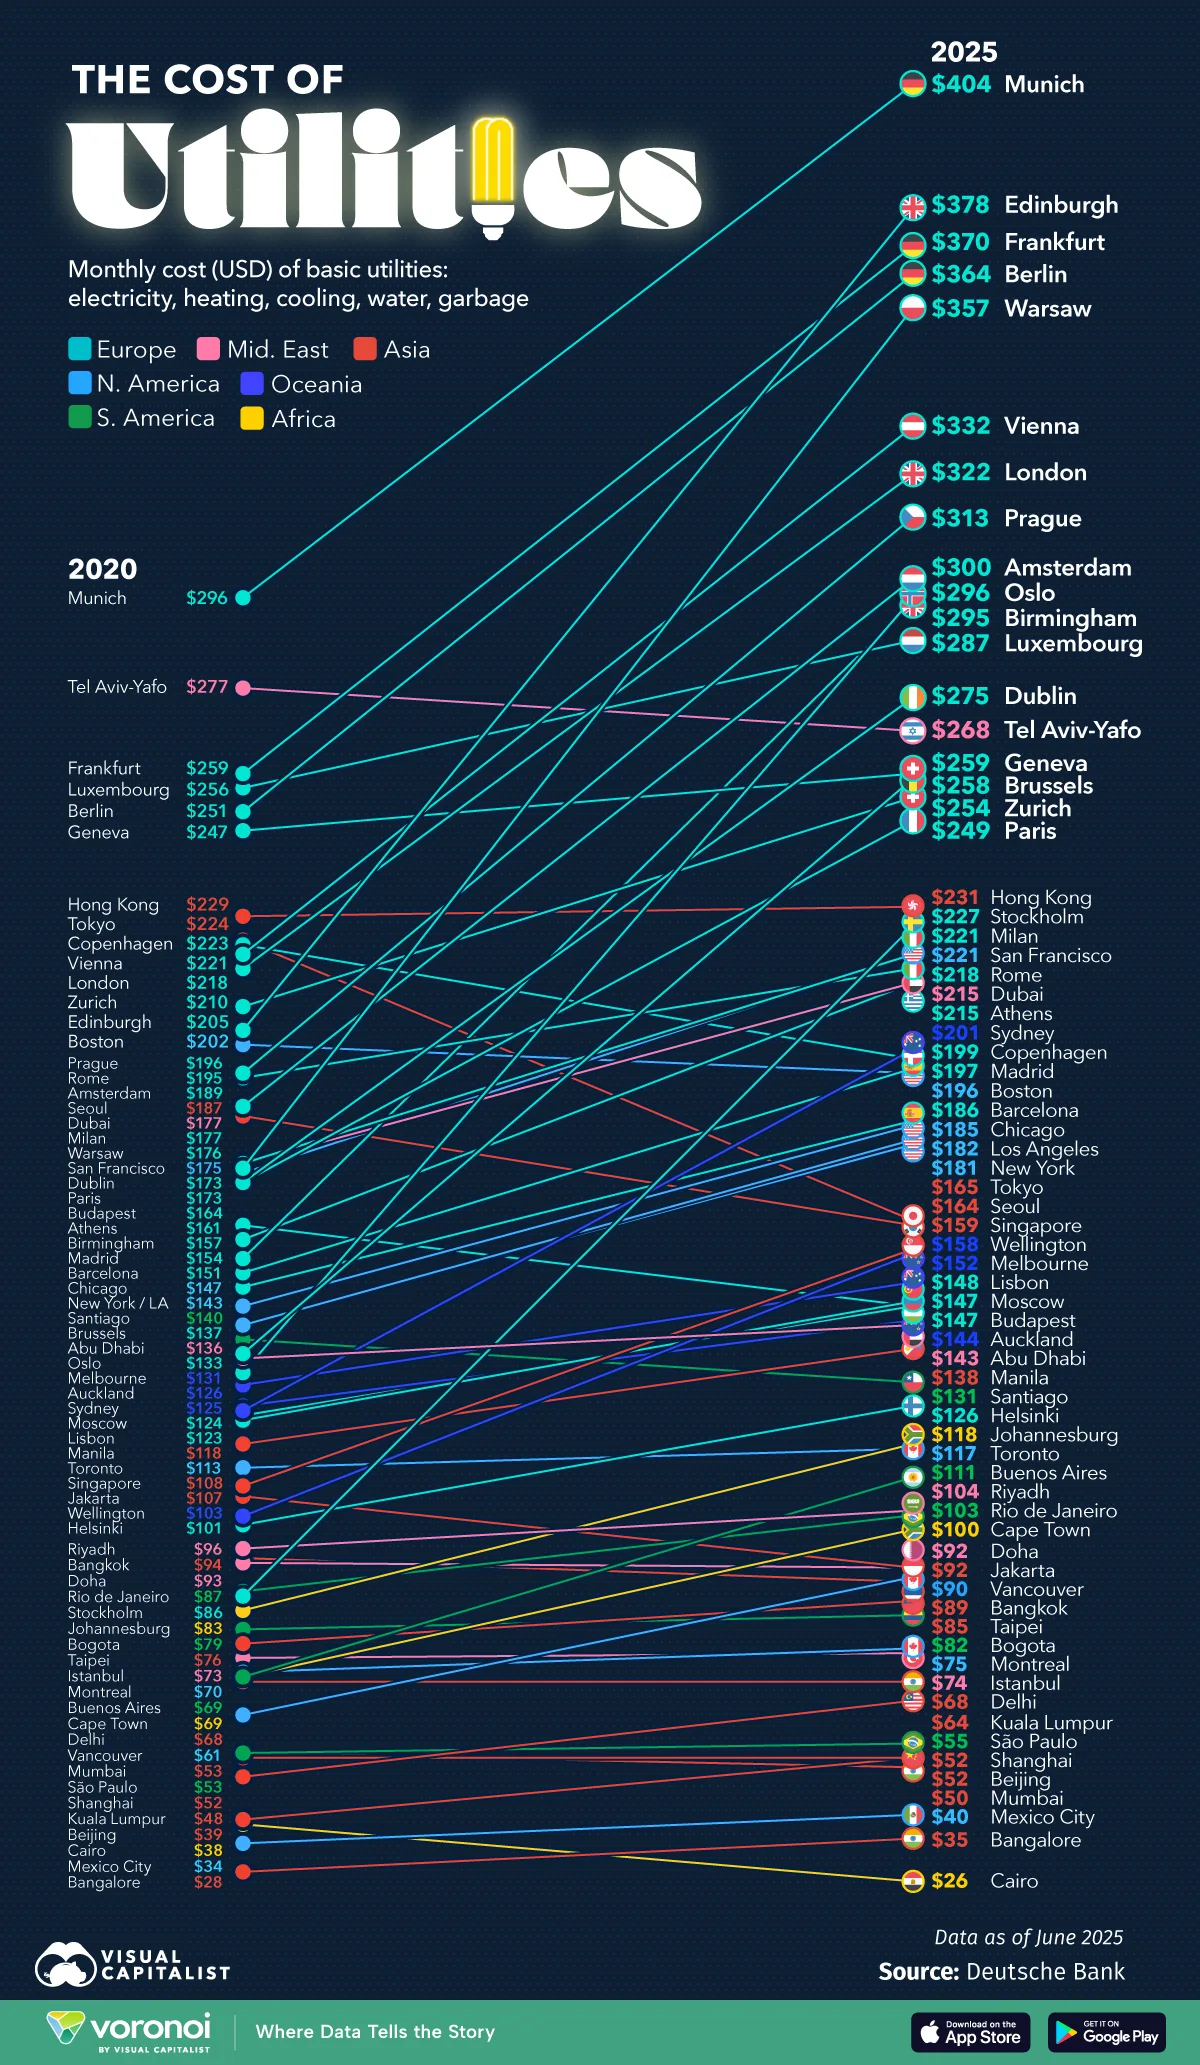
This graphic shows the average cost of utilities around the world, based on data from Deutsche Bank.
European Cities Face Soaring Cost of Utilities Since 2020
Below, we show the average monthly cost of electricity, heating, water, and garbage in 2025:
| City | Country | Monthly Cost of Basic Utilities 2025 (USD) | 5-Year Cumulative Change (%) |
|---|---|---|---|
 Munich Munich |
Germany | $404 | 37 |
 Edinburgh Edinburgh |
United Kingdom | $378 | 85 |
| Frankfurt |
Germany | $370 | 43 |
| Berlin |
Germany | $364 | 45 |
 Warsaw Warsaw |
Poland | $357 | 103 |
 Vienna Vienna |
Austria | $332 | 50 |
| London |
United Kingdom | $322 | 48 |
 Prague Prague |
Czech Republic | $313 | 59 |
 Amsterdam Amsterdam |
Netherlands | $300 | 59 |
 Oslo Oslo |
Norway | $296 | 122 |
| Birmingham |
United Kingdom | $295 | 88 |
 Luxembourg Luxembourg |
Luxembourg | $287 | 12 |
 Dublin Dublin |
Ireland | $275 | 59 |
 Tel Aviv-Yafo Tel Aviv-Yafo |
Israel | $268 | -3 |
 Geneva Geneva |
Switzerland | $259 | 5 |
 Brussels Brussels |
Belgium | $258 | 88 |
| Zurich |
Switzerland | $254 | 21 |
 Paris Paris |
France | $249 | 44 |
 Hong Kong Hong Kong |
Hong Kong | $231 | 1 |
 Stockholm Stockholm |
Sweden | $227 | 163 |
 Milan Milan |
Italy | $221 | 25 |
 San Francisco San Francisco |
United States | $221 | 26 |
| Rome |
Italy | $218 | 12 |
 Dubai Dubai |
United Arab Emirates | $215 | 22 |
 Athens Athens |
Greece | $215 | 33 |
 Sydney Sydney |
Australia | $201 | 62 |
 Copenhagen Copenhagen |
Denmark | $199 | -11 |
 Madrid Madrid |
Spain | $197 | 28 |
| Boston |
United States | $196 | -3 |
| Barcelona |
Spain | $186 | 23 |
| Chicago |
United States | $185 | 25 |
| Los Angeles |
United States | $182 | 28 |
| New York |
United States | $181 | 27 |
 Tokyo Tokyo |
Japan | $165 | -26 |
 Seoul Seoul |
South Korea | $164 | -12 |
 Singapore Singapore |
Singapore | $159 | 47 |
 Wellington Wellington |
New Zealand | $158 | 54 |
| Melbourne |
Australia | $152 | 16 |
 Lisbon Lisbon |
Portugal | $148 | 21 |
 Moscow Moscow |
Russia | $147 | 19 |
 Budapest Budapest |
Hungary | $147 | -11 |
| Auckland |
New Zealand | $144 | 14 |
| Abu Dhabi |
United Arab Emirates | $143 | 5 |
 Manila Manila |
Philippines | $138 | 17 |
 Santiago Santiago |
Chile | $131 | -7 |
 Helsinki Helsinki |
Finland | $126 | 25 |
 Johannesburg Johannesburg |
South Africa | $118 | 43 |
 Toronto Toronto |
Canada | $117 | 4 |
 Buenos Aires Buenos Aires |
Argentina | $111 | 60 |
 Riyadh Riyadh |
Saudi Arabia | $104 | 9 |
 Rio de Janeiro Rio de Janeiro |
Brazil | $103 | 19 |
| Cape Town |
South Africa | $100 | 44 |
 Doha Doha |
Qatar | $92 | -1 |
 Jakarta Jakarta |
Indonesia | $92 | -14 |
| Vancouver |
Canada | $90 | 48 |
 Bangkok Bangkok |
Thailand | $89 | -5 |
 Taipei Taipei |
Taiwan | $85 | 13 |
 Bogota Bogota |
Colombia | $82 | 4 |
| Montreal |
Canada | $75 | 7 |
 Istanbul Istanbul |
Turkey | $74 | 1 |
 Delhi Delhi |
India | $68 | 1 |
 Kuala Lumpur Kuala Lumpur |
Malaysia | $64 | 35 |
| São Paulo |
Brazil | $55 | 4 |
 Shanghai Shanghai |
China | $52 | 1 |
| Beijing |
China | $52 | 35 |
| Mumbai |
India | $50 | -5 |
 Mexico City Mexico City |
Mexico | $40 | 17 |
| Bangalore |
India | $35 | 23 |
 Cairo Cairo |
Egypt | $26 | -31 |
Munich, Germany tops the list with average utility costs of $404 per month.
Given high electricity prices, industrial firms in Germany risk reducing production, closing down, or moving abroad. In the aluminum sector, for instance, power costs alone were nearly triple the cost of selling a tonne of aluminum on the global market this summer.
Similarly, consumers and businesses alike are watching their wallets in the UK, Poland, Austria and Czechia given energy scarcity.
By comparison, utility costs average $181 in New York City and $221 in San Francisco.
In Cairo, utility costs have dropped 31% over the past five years, averaging $26 per month. The decline comes as the Egyptian pound has fallen nearly 70% against the U.S. dollar since 2022, weighed down by geopolitical shocks and economic imbalances.
Tokyo has also seen a double-digit decline in utility costs in relative terms, largely driven by a weaker yen.
Learn More on the Voronoi App 
To learn more about this topic, check out this graphic on the U.S. states that pay the most for electricity.