Ranked: The Countries That Produce the Most Steel
See visuals like this from many other data creators on our Voronoi app. Download it for free on iOS or Android and discover incredible data-driven charts from a variety of trusted sources.
Key Takeaways
- China accounted for 52% of global steel production in 2025, producing more steel than the next 12 countries combined.
- India remained the world’s second-largest steel producer, while the U.S. and Japan each contributed roughly 4.4% of global output.
Steel remains one of the world’s most important industrial materials, underpinning everything from construction and infrastructure to automobiles and manufacturing. As a result, the countries producing the most steel play an outsized role in the global economy and commodity markets.
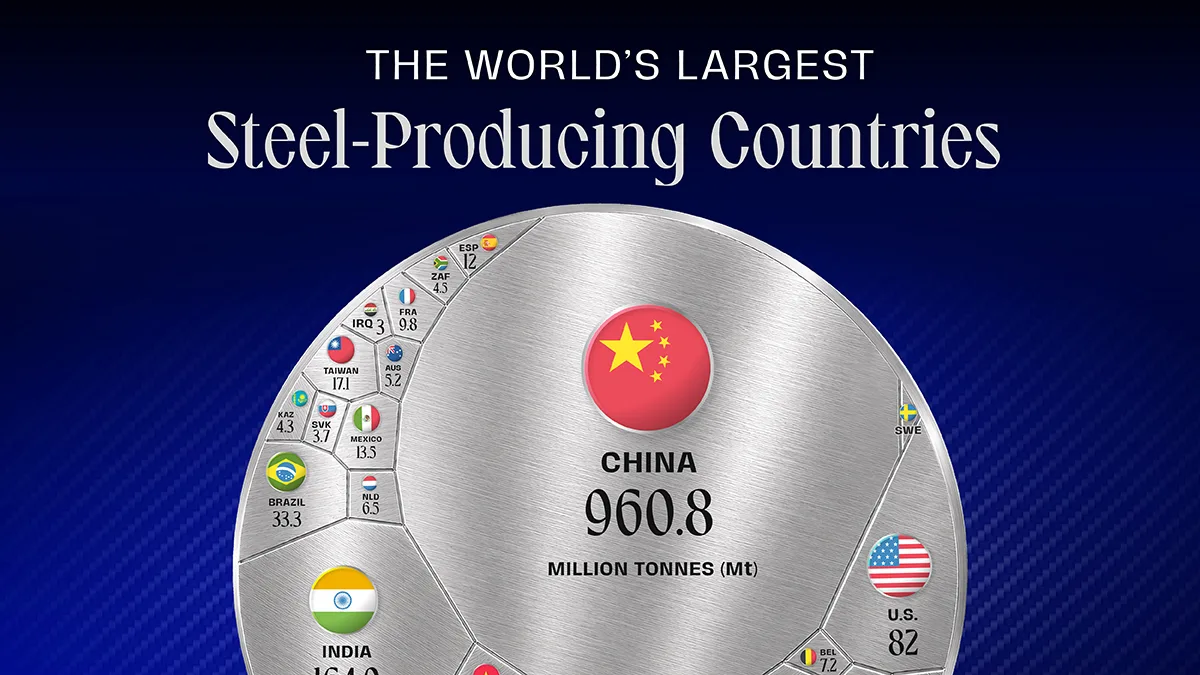
This graphic ranks the world’s largest steel-producing countries in 2025, based on crude steel output data from the World Steel Association.
China dominates global steel production, while Asian economies and established industrial powers like the U.S., Japan, and Germany remain major contributors.
China’s Massive Lead in Steel Production
Global crude steel production totaled 1,849.4 Mt in 2025, with China alone producing 960.8 Mt.
That means China accounted for 52% of the world’s steel output, more than the next 12 largest producers combined.
China’s enormous domestic construction sector, export manufacturing base, and state-backed industrial capacity continue to support its leadership position.
| Rank | Country | Millions of tonnes (Mt) | Share (%) |
|---|---|---|---|
| 1 |  China China |
960.8 | 52.0% |
| 2 |  India India |
164.9 | 8.9% |
| 3 |  United States United States |
82.0 | 4.4% |
| 4 |  Japan Japan |
80.7 | 4.4% |
| 5 |  Russia Russia |
67.8 | 3.7% |
| 6 |  South Korea South Korea |
61.9 | 3.3% |
| 7 |  Türkiye Türkiye |
38.1 | 2.1% |
| 8 |  Germany Germany |
34.1 | 1.8% |
| 9 |  Brazil Brazil |
33.3 | 1.8% |
| 10 |  Iran Iran |
31.8 | 1.7% |
| 11 |  Viet Nam Viet Nam |
24.7 | 1.3% |
| 12 |  Italy Italy |
20.7 | 1.1% |
| 13 |  Indonesia Indonesia |
19.0 | 1.0% |
| 14 |  Taiwan, China Taiwan, China |
17.1 | 0.9% |
| 15 |  Mexico Mexico |
13.5 | 0.7% |
| 16 |  Spain Spain |
12.0 | 0.6% |
| 17 |  Canada Canada |
11.5 | 0.6% |
| 18 |  Saudi Arabia Saudi Arabia |
10.8 | 0.6% |
| 19 |  Egypt Egypt |
10.6 | 0.6% |
| 20 |  France France |
9.8 | 0.5% |
| 21 |  Malaysia Malaysia |
9.0 | 0.5% |
| 22 |  Austria Austria |
7.6 | 0.4% |
| 23 |  Ukraine Ukraine |
7.4 | 0.4% |
| 24 |  Poland Poland |
7.2 | 0.4% |
| 25 |  Belgium Belgium |
7.2 | 0.4% |
| 26 |  Netherlands Netherlands |
6.5 | 0.4% |
| 27 |  Algeria Algeria |
5.3 | 0.3% |
| 28 |  Australia Australia |
5.2 | 0.3% |
| 29 |  Thailand Thailand |
5.0 | 0.3% |
| 30 |  Bangladesh Bangladesh |
4.5 | 0.2% |
| 31 |  South Africa South Africa |
4.5 | 0.2% |
| 32 |  Kazakhstan Kazakhstan |
4.3 | 0.2% |
| 33 |  Argentina Argentina |
4.0 | 0.2% |
| 34 |  Sweden Sweden |
4.0 | 0.2% |
| 35 |  United Arab Emirates United Arab Emirates |
3.8 | 0.2% |
| 36 |  Finland Finland |
3.7 | 0.2% |
| 37 |  Slovakia Slovakia |
3.7 | 0.2% |
| 38 |  Pakistan Pakistan |
3.6 | 0.2% |
| 39 |  Iraq Iraq |
3.0 | 0.2% |
| 40 |  Oman Oman |
3.0 | 0.2% |
| — | Others | 41.8 | 2.3% |
| — |  World World |
1,849.40 | 100.0% |
China’s steel industry also has broad implications for global commodity markets. Demand from Chinese steelmakers heavily influences iron ore and coking coal prices worldwide. At the same time, concerns around overcapacity and exports continue to shape international trade discussions.
India Continues to Rise
India ranked second globally with 164.9 Mt of steel production, representing 8.9% of world output.
The country has steadily expanded steel capacity over recent decades as infrastructure investment and urbanization accelerate. Government initiatives aimed at boosting manufacturing have also supported long-term growth in the sector.
India remains far behind China in absolute output, but its steel demand is being supported by major investments in roads, railways, housing, and energy infrastructure.
Advanced Economies Maintain Significant Output
The United States and Japan produced 82 Mt and 80.7 Mt of steel respectively, each contributing roughly 4.4% of global production.
South Korea, Germany, and Italy also remained among the world’s top producers despite slower industrial growth in many developed economies.
Many advanced economies are now focused less on expanding output and more on modernizing steel production. Because steelmaking is highly energy-intensive, countries across Europe, North America, and Asia are investing in cleaner technologies such as electric arc furnaces and hydrogen-based steel production.
Learn More on the Voronoi App 
If you enjoyed today’s post, check out Visualizing the U.S. Copper Gap on Voronoi, the new app from Visual Capitalist.Use This Visualization