Ranked: The Jobs Americans Quit Most—and Least
See visuals like this from many other data creators on our Voronoi app. Download the app for free on iOS or Android and discover data-driven charts from a variety of trusted sources.
Key Takeaways:
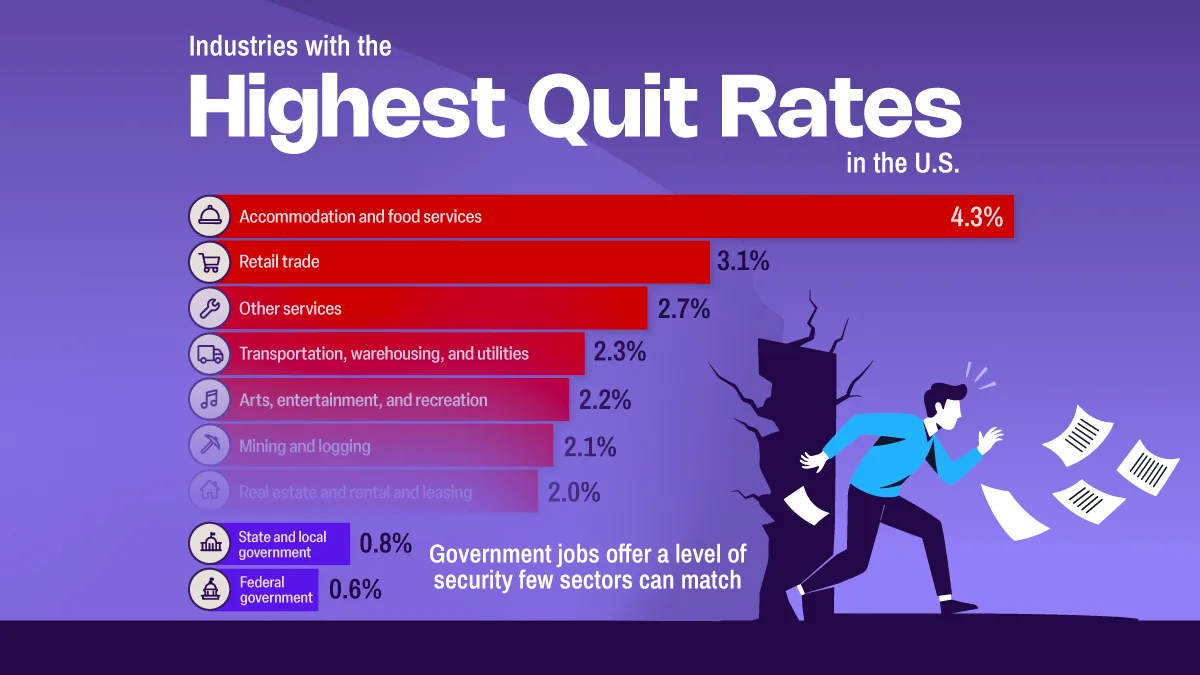
- Workers in accommodation and food services quit at a 4.3% rate in March 2026, more than double the U.S. average.
- Government jobs had the lowest quit rates at 0.6-0.8%, highlighting the staying power of pensions, benefits, and job security.
- Industries with lower pay, variable schedules, or higher turnover tended to see the most worker churn.
Why do some jobs keep workers for decades while others struggle to retain employees?
The answer often comes down to a combination of pay, benefits, scheduling stability, career advancement, and job security. These factors vary dramatically across sectors, creating large differences in worker turnover.
Using data from the U.S. Bureau of Labor Statistics, this graphic ranks industries by quit rate in March 2026. Because quits are voluntary, the measure offers a useful snapshot of where workers are most willing—and least willing—to walk away.
Why Are Quit Rates So High in Food and Accommodation?
Accommodation and food services posted a 4.3% quit rate in March 2026, the highest of any major industry.
This reflects long-running structural challenges in the sector, including low base wages, tip volatility, irregular schedules, and physically demanding work.
The data table below provides an overview of the quit rates of different industries in America:
| Rank | Industry | Quit Rate (%) |
|---|---|---|
| 1 |  Accommodation and food services Accommodation and food services |
4.3% |
| 2 |  Retail trade Retail trade |
3.1% |
| 3 |  Other services Other services |
2.7% |
| 4 |  Transportation, warehousing, and utilities Transportation, warehousing, and utilities |
2.3% |
| 5 |  Arts, entertainment, and recreation Arts, entertainment, and recreation |
2.2% |
| 6 |  Mining and logging Mining and logging |
2.1% |
| 7 |  Real estate and rental and leasing Real estate and rental and leasing |
2.0% |
| 8 |  Professional and business services Professional and business services |
2.0% |
| 9 |  Health care and social assistance Health care and social assistance |
1.9% |
| 10 |  Nondurable goods manufacturing Nondurable goods manufacturing |
1.9% |
| 11 |  Construction Construction |
1.7% |
| 12 |  Private educational services Private educational services |
1.3% |
| 13 |  Finance and insurance Finance and insurance |
1.2% |
| 14 |  Wholesale trade Wholesale trade |
1.2% |
| 15 |  Information Information |
1.1% |
| 16 |  Durable goods manufacturing Durable goods manufacturing |
1.0% |
| 17 |  State and local government State and local government |
0.8% |
| 18 |  Federal government Federal government |
0.6% |
Retail trade also ranked high, at 3.1%. Like food services, retail often has lower barriers to entry and more part-time roles, which can make switching jobs easier when workers find better pay, hours, or working conditions elsewhere.
Government Jobs Have the Lowest Quit Rates
Government had the lowest quit rate in the dataset at 0.6% for federal government employees, and 0.8% for state and local government. Civil service protections, pensions, strong benefits, and predictable scheduling all make these roles harder to leave.
Public-sector pay is also tilted toward benefits in a way the private sector rarely matches (38.3% of total compensation versus 29.9% according to the BLS) and much of that value, especially pensions, is earned by staying. The result is a workforce with real financial reasons not to leave.
This helps explain why public-sector turnover often looks very different from the private sector, where compensation, flexibility, and workplace culture can shift more quickly.
Along with government jobs, relatively higher-paying industries like the information industry (1.1% quit rate) along with finance and insurance (1.2%) also have relatively low quit rates, also thanks to their higher salaries, stronger benefits, and more predictable schedules.
The Great Resignation of 2022
In 2022, around 50.5 million Americans quit their jobs, setting a record and surpassing the previous high from 2021, according to CNBC’s analysis of federal JOLTS data. The surge was driven by a tight labor market, higher wage offers, and workers reassessing priorities after the pandemic, resulting in an overall quit rate which peaked at 3.0%.
As of March 2026, the all-industry quit rate has cooled to 2.0%, and incentives for changing jobs had dimmed. With fewer openings and a narrower pay premium for job switchers, many workers appear less willing to take the leap.
Learn More on the Voronoi App 
To learn more about how U.S. workers have changed jobs over time, check out Americans and Their Changing Jobs Over the Last 20 Years on the Voronoi app.