Ranked: The Top Buyers of U.S. Oil in 2025
See visuals like this from many other data creators on our Voronoi app. Download it for free on iOS or Android and discover incredible data-driven charts from a variety of trusted sources.
Key Takeaways
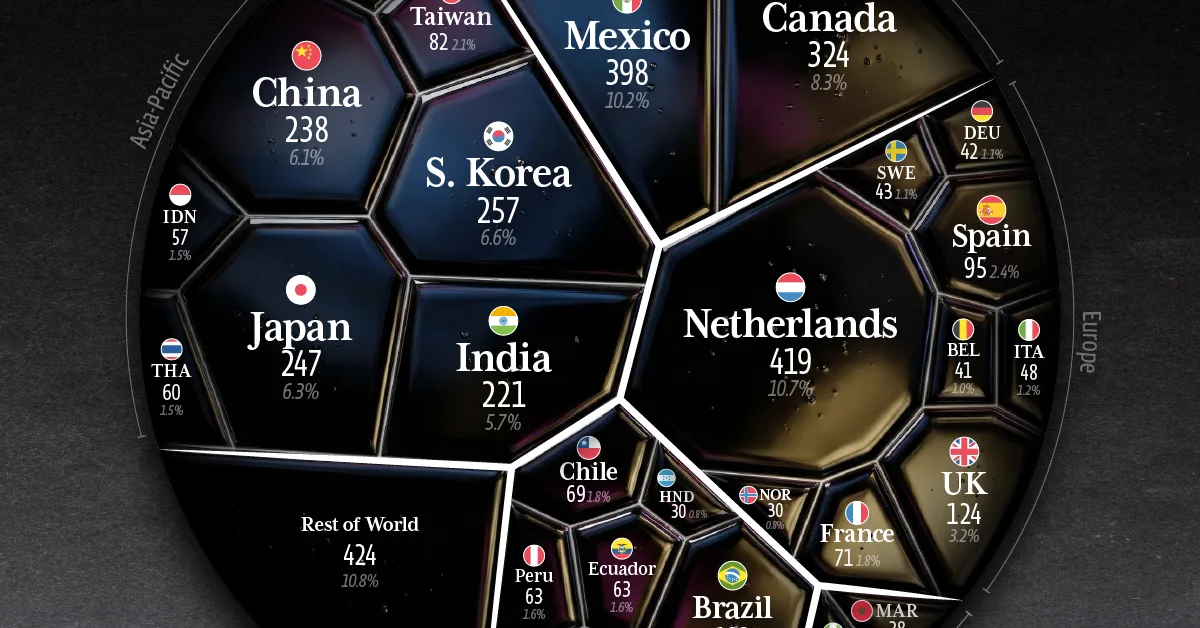
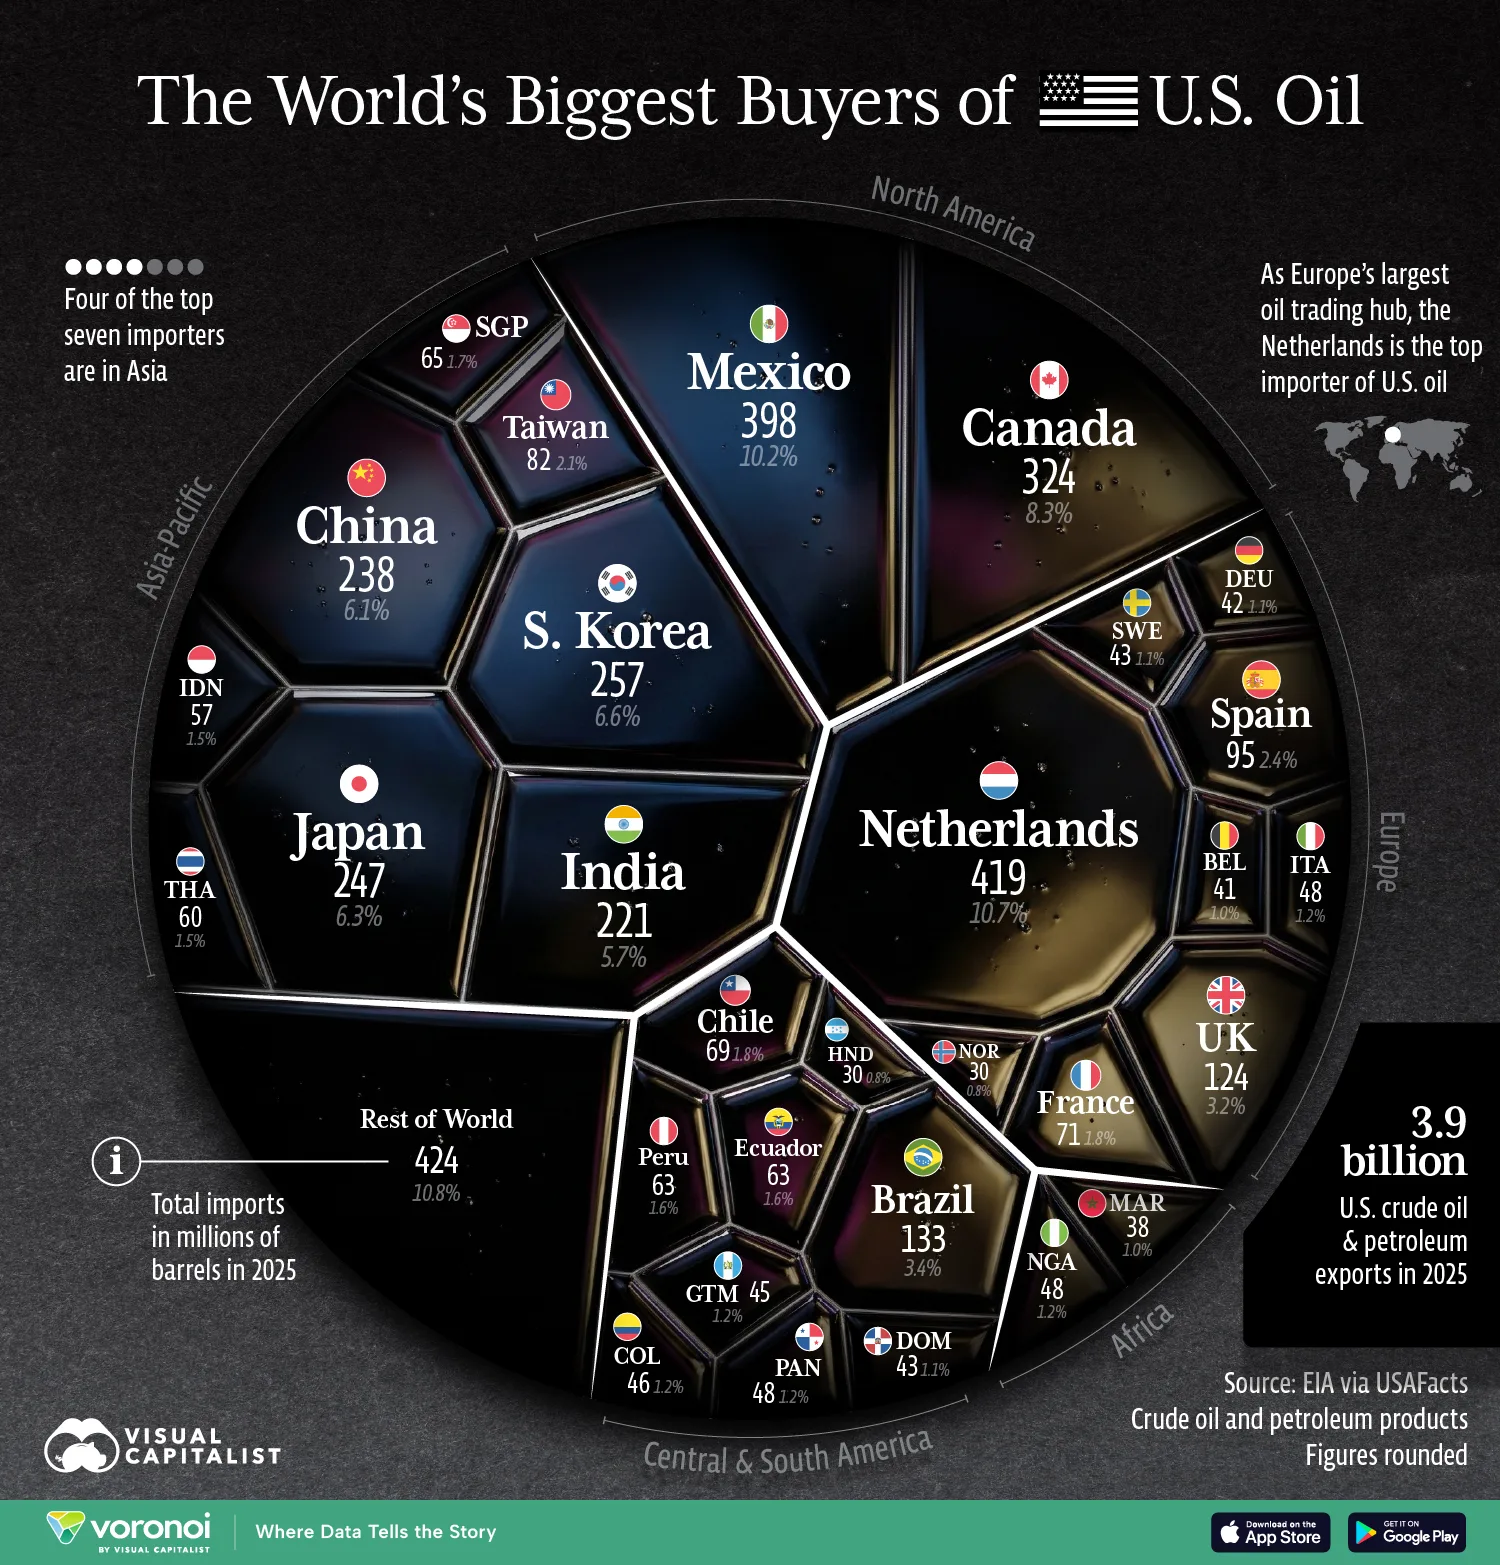
- The Netherlands imported 419 million barrels, making it the world’s largest buyer of American crude, ahead of much larger economies like China, India, and Japan.
- Mexico fell to second place, importing 398 million barrels.
- China’s imports of U.S. oil declined 34% in 2025, while India’s rose 35%, highlighting diverging demand trends between the world’s two most populous countries.
The Netherlands became the world’s largest buyer of U.S. oil in 2025, importing more American crude than much larger economies such as China, India, and Japan.
Nearly 4 billion barrels of U.S. oil were shipped abroad last year, underscoring the country’s growing role as a global energy exporter.
Much of the Netherlands’ imported crude passes through the Port of Rotterdam, one of the world’s largest energy hubs, where oil is refined or redistributed across Europe.
Using data from the U.S. Energy Information Administration via USAFacts, this graphic ranks the largest buyers of U.S. oil in 2025.
The World’s Biggest Buyers of U.S. Oil
Below, we show the largest importers of U.S. crude oil and petroleum products:
| Rank | Country | Region | Total Imports (Millions of Barrels 2025) | Share of Total |
|---|---|---|---|---|
| 1 |  Netherlands Netherlands |
Europe | 419 | 10.7% |
| 2 |  Mexico Mexico |
North America | 398 | 10.2% |
| 3 |  Canada Canada |
North America | 324 | 8.3% |
| 4 |  South Korea South Korea |
Asia-Pacific | 257 | 6.6% |
| 5 |  Japan Japan |
Asia-Pacific | 247 | 6.3% |
| 6 |  China China |
Asia-Pacific | 238 | 6.1% |
| 7 |  India India |
Asia-Pacific | 221 | 5.7% |
| 8 |  Brazil Brazil |
Central & South America | 133 | 3.4% |
| 9 |  United Kingdom United Kingdom |
Europe | 124 | 3.2% |
| 10 |  Spain Spain |
Europe | 95 | 2.4% |
| 11 |  Taiwan Taiwan |
Asia-Pacific | 82 | 2.1% |
| 12 |  France France |
Europe | 71 | 1.8% |
| 13 |  Chile Chile |
Central & South America | 69 | 1.8% |
| 14 |  Singapore Singapore |
Asia-Pacific | 65 | 1.7% |
| 15 |  Ecuador Ecuador |
Central & South America | 63 | 1.6% |
| 16 |  Peru Peru |
Central & South America | 63 | 1.6% |
| 17 |  Thailand Thailand |
Asia-Pacific | 60 | 1.5% |
| 18 |  Indonesia Indonesia |
Asia-Pacific | 57 | 1.5% |
| 19 |  Panama Panama |
Central & South America | 48 | 1.2% |
| 20 |  Italy Italy |
Europe | 48 | 1.2% |
| 21 |  Nigeria Nigeria |
Africa | 48 | 1.2% |
| 22 |  Colombia Colombia |
Central & South America | 46 | 1.2% |
| 23 |  Guatemala Guatemala |
Central & South America | 45 | 1.2% |
| 24 |  Dominican Republic Dominican Republic |
Central & South America | 43 | 1.1% |
| 25 |  Sweden Sweden |
Europe | 43 | 1.1% |
| 26 |  Germany Germany |
Europe | 42 | 1.1% |
| 27 |  Belgium Belgium |
Europe | 41 | 1.0% |
| 28 |  Morocco Morocco |
Africa | 38 | 1.0% |
| 29 |  Honduras Honduras |
Central & South America | 30 | 0.8% |
| 30 |  Norway Norway |
Europe | 30 | 0.8% |
The Netherlands led global imports with 419 million barrels, after purchases surged by roughly 31 million barrels in 2025.
Since Russia’s invasion of Ukraine in 2022, U.S. crude has played a growing role in replacing Russian energy across Europe. A large share flows through the Port of Rotterdam, where roughly 1.1 million barrels of oil pass through each day.
Canada ranked third, importing 324 million barrels, a modest increase from the previous year. Despite its vast oil reserves, Canada lacks sufficient refining capacity and east-west pipeline infrastructure, leading it to rely heavily on crude imports from the United States.
Meanwhile, China’s imports of U.S. oil fell by 81 million barrels in 2025, pushing the country down to the sixth-largest buyer, from third place a year earlier. Amid escalating trade tensions, China increasingly turned to discounted sanctioned crude from Iran, Venezuela, and Russia.
India, meanwhile, increased U.S. crude shipments in 2025. Overall, U.S. crude exports jumped by 57 million barrels, rising 35% over the year.
Learn More on the Voronoi App 
To learn more about this topic, check out this graphic on the world’s biggest oil producers.