Ranked: The World’s 40 Most Valuable Food Commodities
Key Takeaways
- Milk is the world’s most valuable food commodity, ahead of rice and pork.
- Animal products claim five of the top eight spots, led by milk, pork, and beef.
- Tomatoes are the highest-ranking produce item, at $136 billion.
Food commodities generate trillions of dollars in agricultural production each year, spanning everything from staple grains and livestock to fruits, vegetables, coffee, and cocoa.
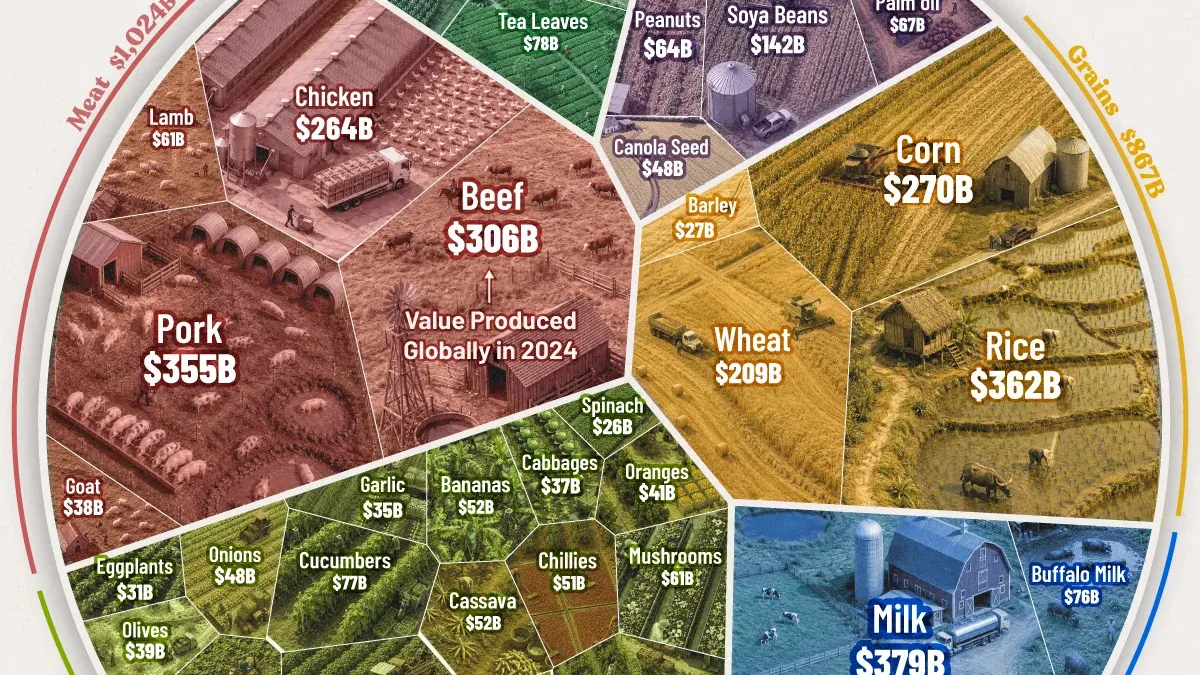
This visualization ranks 40 food commodities by gross production value in 2024, based on data from the UN Food and Agriculture Organization. Together, the commodities shown generated roughly $4.3 trillion in value.
Milk Is the World’s Most Valuable Food Commodity
At $379 billion, milk edges out rice ($362 billion) and pork ($355 billion) for the top spot. Just $24 billion separates the three most valuable commodities in the ranking.
| Rank | Commodity | Gross Production Value 2024 |
|---|---|---|
| 1 | Milk | $379B |
| 2 | Rice | $362B |
| 3 | Pork | $355B |
| 4 | Beef | $306B |
| 5 | Corn | $270B |
| 6 | Chicken | $264B |
| 7 | Wheat | $209B |
| 8 | Eggs | $157B |
| 9 | Soya beans | $142B |
| 10 | Tomatoes | $136B |
| 11 | Potatoes | $122B |
| 12 | Apples | $112B |
| 13 | Grapes | $97B |
| 14 | Sugar cane | $96B |
| 15 | Sweet potatoes | $89B |
| 16 | Tea leaves | $78B |
| 17 | Cucumbers | $77B |
| 18 | Buffalo milk | $76B |
| 19 | Seed cotton | $72B |
| 20 | Palm oil | $67B |
| 21 | Peanuts | $64B |
| 22 | Mushrooms | $61B |
| 23 | Lamb | $61B |
| 24 | Watermelons | $53B |
| 25 | Cassava | $52B |
| 26 | Bananas | $52B |
| 27 | Chillies | $51B |
| 28 | Onions | $48B |
| 29 | Colza seed | $48B |
| 30 | Mangoes | $45B |
| 31 | Oranges | $41B |
| 32 | Olives | $39B |
| 33 | Goat | $38B |
| 34 | Cabbages | $37B |
| 35 | Garlic | $35B |
| 36 | Beans | $34B |
| 37 | Eggplants | $31B |
| 38 | Strawberries | $29B |
| 39 | Barley | $27B |
| 40 | Spinach | $26B |
| — | Top 40 Total | $4.3T |
Milk’s position reflects the enormous scale of global dairy production. Output reached 985 million metric tons in 2024, with cattle accounting for 81% of the total. Buffaloes are another major source, particularly in Asia.
Five Meat Commodities Generate Over $1 Trillion
Pork, beef, chicken, lamb, and goat have a combined production value of roughly $1.02 trillion. Pork alone ranks third overall at $355 billion, followed by beef ($306 billion) and chicken ($264 billion).
Global meat production reached 374 million metric tons in 2024, up seven million metric tons from the previous year.
Looking ahead, livestock production is projected to grow 15% by 2035, outpacing crop production as rising incomes in middle-income countries shift diets toward more animal products.
Produce Commodities Add Up to $1.2 Trillion
Tomatoes are the only produce item to rank in the top 10, with a production value of $136 billion. Collectively, however, the produce commodities shown generate over $1.2 trillion in value.
Potatoes rank second among produce items at $122 billion, followed by apples ($112 billion), grapes ($97 billion), and sweet potatoes ($89 billion). Unlike meat and grains, produce derives its scale from a much wider range of commodities across the ranking.
The Unexpected Commodities Worth More Than $50 Billion
Beyond the world’s biggest staples, several less obvious commodities generate tens of billions of dollars in production value each year.
Mushrooms rank 22nd at $61 billion, putting them ahead of bananas at $52 billion. Watermelons generate $53 billion, while cassava and chilies also cross the $50 billion mark.
The ranking shows how production value can diverge from a food’s perceived economic importance. Commodities such as mushrooms, watermelons, cassava, and chiles each generate more than $50 billion annually, highlighting the scale of foods that rarely receive the same attention as wheat, rice, or corn.
Together, they underscore the breadth of the global agricultural economy, where value extends far beyond the handful of staple commodities that dominate global trade and food-security discussions.
Learn More on the Voronoi App
To learn more about this topic, check out this graphic on the number of farms in each state.