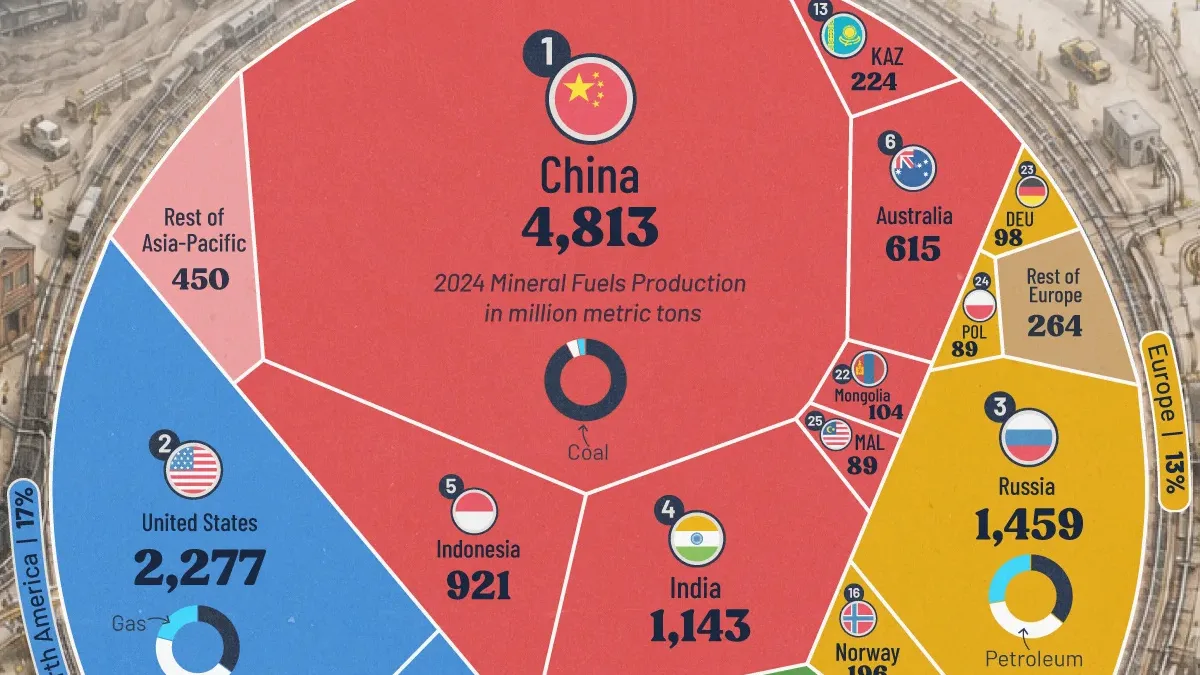
Ranked: The World’s Biggest Mineral Fuel Producers
Key Takeaways
- China produces more than twice as much mineral fuel by weight as the United States, the world’s second-largest producer.
- Coal is the dominant fuel produced by three of the world’s top five producers by volume.
- Measuring production by weight favors coal-heavy economies over countries focused on lower-volume fuels such as oil, gas, and uranium.
Mineral fuels underpin electricity generation, transportation, and industrial activity, but the countries producing the largest quantities vary significantly depending on how output is measured.
This visualization ranks mineral fuel production by country in 2024, based on total production in metric tons. The data comes from the Austrian Ministry of Finance and covers steam coal, coking coal, lignite, petroleum, oil shales, natural gas, and uranium.
Because the ranking measures physical production rather than value or energy content, high-volume commodities such as coal have an outsized influence on the results. This helps explain why several coal-producing economies rank ahead of some of the world’s biggest oil and gas producers.
China Leads the Mineral Fuels Production Ranking
China ranks first with 4.8 billion metric tons of mineral fuel production in 2024, equal to 28.6% of global output. The vast majority of China’s output comes from steam coal and coking coal, which also helps make it the world’s leading mineral producer overall.
The table below shows the mineral fuel production of the leading 25 countries in million metric tons and as a share of the global total:
| Rank | Country | 2024 Production (Million Metric Tons) |
Share of Global Total (%) |
|---|---|---|---|
| 1 |  China China |
4,812.6 | 28.6 |
| 2 |  United States United States |
2,277.2 | 13.5 |
| 3 |  Russia Russia |
1,459.0 | 8.7 |
| 4 |  India India |
1,142.8 | 6.8 |
| 5 |  Indonesia Indonesia |
921.4 | 5.5 |
| 6 |  Australia Australia |
614.6 | 3.7 |
| 7 |  Saudi Arabia Saudi Arabia |
594.2 | 3.5 |
| 8 |  Canada Canada |
489.9 | 2.9 |
| 9 |  Iran Iran |
457.1 | 2.7 |
| 10 |  South Africa South Africa |
234.0 | 1.4 |
| 11 |  UAE UAE |
228.9 | 1.4 |
| 12 |  Iraq Iraq |
225.2 | 1.3 |
| 13 |  Kazakhstan Kazakhstan |
224.2 | 1.3 |
| 14 |  Qatar Qatar |
211.8 | 1.3 |
| 15 |  Brazil Brazil |
196.6 | 1.2 |
| 16 |  Norway Norway |
196.0 | 1.2 |
| 17 |  Kuwait Kuwait |
154.8 | 0.9 |
| 18 |  Algeria Algeria |
146.8 | 0.9 |
| 19 |  Mexico Mexico |
119.2 | 0.7 |
| 20 |  Nigeria Nigeria |
114.8 | 0.7 |
| 21 |  Colombia Colombia |
107.0 | 0.6 |
| 22 |  Mongolia Mongolia |
104.4 | 0.6 |
| 23 |  Germany Germany |
97.5 | 0.6 |
| 24 |  Poland Poland |
89.3 | 0.5 |
| 25 |  Malaysia Malaysia |
89.3 | 0.5 |
China produces more than twice as much mineral fuel by weight as the United States, which ranks second at 2.28 billion metric tons, or 13.5% of the global total. Their production mixes differ sharply: coal dominates China’s output, while petroleum and natural gas make up most of U.S. production.
Coal Dominates Three of the Top Five Producers
Following China and the U.S., Russia ranks third with 1.46 billion metric tons of mineral fuels, equal to 8.7% of the global total. Its production mix resembles that of the U.S., with petroleum and natural gas accounting for the largest share.
India ranks fourth with 1.14 billion metric tons, representing 6.8% of global output, with steam coal as its largest mineral fuel category. Indonesia ranks fifth at 921.4 million metric tons, or 5.5% of global output, with steam coal also dominating its production.
Together, China, the U.S., Russia, India, and Indonesia produced 63.1% of the world’s mineral fuels by weight in 2024. China alone accounted for nearly three in every 10 metric tons.
The table below breaks down mineral fuel production for the top five producing countries by fuel type:
| Country | Steam Coal (Mt) | Coking Coal (Mt) | Lignite (Mt) | Petroleum (Mt) | Gas (Mt) | Uranium (kt) |
|---|---|---|---|---|---|---|
| China |
3,883.5 | 519.0 | 0 | 212.9 | 197.2 | 1.9 |
| United States |
372.7 | 64.8 | 36.3 | 948.8 | 854.6 | 0.3 |
| Russia |
218.0 | 110.0 | 98.6 | 523.0 | 509.4 | 3.2 |
| India |
973.9 | 65.7 | 45.5 | 28.9 | 28.8 | 0.6 |
| Indonesia |
829.6 | 6.6 | 0 | 28.9 | 56.4 | 0 |
Asia-Pacific Produces Half of the World’s Mineral Fuels
At the regional level, Asia-Pacific produced 8.36 billion metric tons of mineral fuels in 2024, equal to 49.7% of global output by weight.
North America ranked second at 2.91 billion metric tons, or 17.3% of the total. The Middle East and Europe followed closely, accounting for 12.9% and 12.5%, respectively.
Saudi Arabia illustrates how measuring mineral fuels by weight can change the ranking. Despite ranking third among crude oil producers, it places seventh here at 594.2 million metric tons, or 3.5% of global mineral fuel output. Coal-heavy countries can rank higher because coal is produced in far greater physical volumes than more energy-dense fuels.
Beyond the largest producers, output drops off quickly. Germany, Poland, and Malaysia each account for less than 1% of global mineral fuel production.
Learn More on the Voronoi App 
If you enjoyed today’s post, check out this graphic on the world’s leading coal-producing countries.