Ranked: The World’s Biggest Natural Gas Producers
See visuals like this from many other data creators on our Voronoi app. Download it for free on iOS or Android and discover incredible data-driven charts from a variety of trusted sources.
Key Takeaways
- The U.S. produces 25% of global natural gas, far ahead of any other country.
- Its output is nearly equal to Iran and China combined.
- Global supply is concentrated among a small group of producers, shaping energy markets and LNG trade.
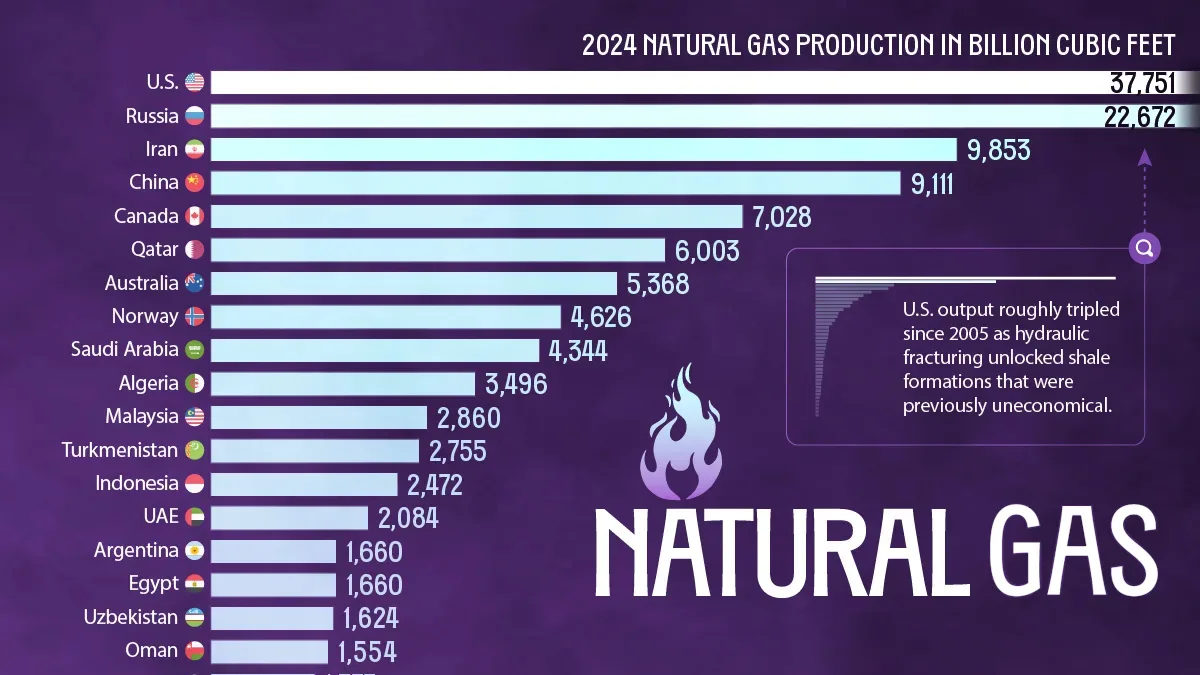
The U.S. has pulled far ahead as the world’s largest natural gas producer, accounting for a quarter of global supply in 2024.
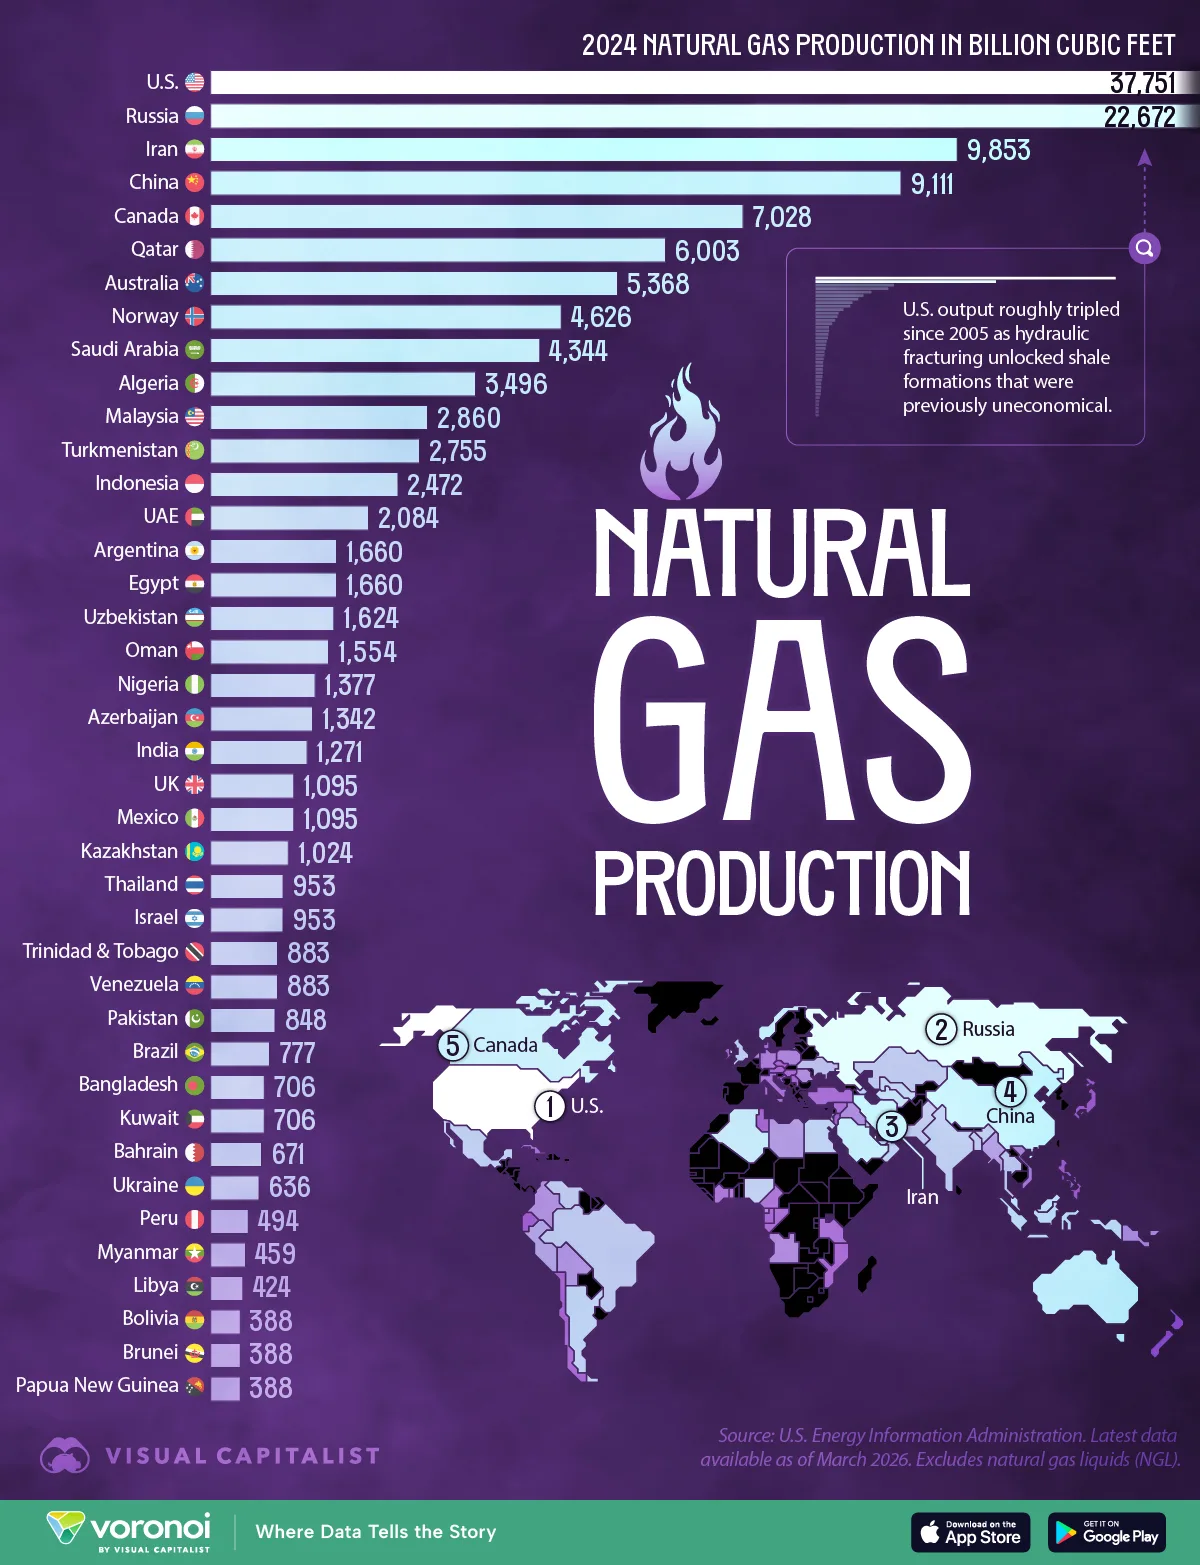
This chart ranks the top gas-producing countries using the latest available data from the U.S. Energy Information Administration, showing how output is concentrated among a handful of players that anchor global energy markets.
That dominance is becoming more important as disruptions in the Middle East tighten supply and shift trade flows toward large, stable producers like the United States.
The U.S. is the World’s Largest Natural Gas Producer
The U.S. isn’t just the top producer. It operates at a completely different scale.
In 2024, it produced 37,751 billion cubic feet of natural gas, more than 1.6x Russia and nearly equal to the combined output of Iran and China. No other country comes close. The gap between the U.S. and Russia alone is larger than the total output of most top-10 producers.
The data table below shows the ranking of natural gas production by country in 2024 in billion cubic feet:
| Rank | Country | Natural Gas Production in 2024 (billion cubic feet) |
|---|---|---|
| 1 |  United States United States |
37,751 |
| 2 |  Russia Russia |
22,672 |
| 3 |  Iran Iran |
9,853 |
| 4 |  China China |
9,111 |
| 5 |  Canada Canada |
7,028 |
| 6 |  Qatar Qatar |
6,003 |
| 7 |  Australia Australia |
5,368 |
| 8 |  Norway Norway |
4,626 |
| 9 |  Saudi Arabia Saudi Arabia |
4,344 |
| 10 |  Algeria Algeria |
3,496 |
| 11 |  Malaysia Malaysia |
2,860 |
| 12 |  Turkmenistan Turkmenistan |
2,755 |
| 13 |  Indonesia Indonesia |
2,472 |
| 14 |  United Arab Emirates United Arab Emirates |
2,084 |
| 15 |  Argentina Argentina |
1,660 |
| 16 |  Egypt Egypt |
1,660 |
| 17 |  Uzbekistan Uzbekistan |
1,624 |
| 18 |  Oman Oman |
1,554 |
| 19 |  Nigeria Nigeria |
1,377 |
| 20 |  Azerbaijan Azerbaijan |
1,342 |
| 21 |  India India |
1,271 |
| 22 |  United Kingdom United Kingdom |
1,095 |
| 23 |  Mexico Mexico |
1,095 |
| 24 |  Kazakhstan Kazakhstan |
1,024 |
| 25 |  Thailand Thailand |
953 |
| 26 |  Israel Israel |
953 |
| 27 |  Trinidad and Tobago Trinidad and Tobago |
883 |
| 28 |  Venezuela Venezuela |
883 |
| 29 |  Pakistan Pakistan |
848 |
| 30 |  Brazil Brazil |
777 |
| 31 |  Bangladesh Bangladesh |
706 |
| 32 |  Kuwait Kuwait |
706 |
| 33 |  Bahrain Bahrain |
671 |
| 34 |  Ukraine Ukraine |
636 |
| 35 |  Peru Peru |
494 |
| 36 |  Myanmar Myanmar |
459 |
| 37 |  Libya Libya |
424 |
| 38 |  Bolivia Bolivia |
388 |
| 39 |  Brunei Brunei |
388 |
| 40 |  Papua New Guinea Papua New Guinea |
388 |
| 41 |  Colombia Colombia |
353 |
| 42 |  Iraq Iraq |
353 |
| 43 |  Netherlands Netherlands |
343 |
| 44 |  Romania Romania |
325 |
| 45 |  Equatorial Guinea Equatorial Guinea |
237 |
| 46 |  Vietnam Vietnam |
226 |
| 47 |  Angola Angola |
205 |
| 48 |  Poland Poland |
184 |
| 49 |  Germany Germany |
145 |
| 50 |  Syria Syria |
131 |
| 51 |  Ghana Ghana |
120 |
| 52 |  New Zealand New Zealand |
117 |
| 53 |  Ivory Coast Ivory Coast |
95 |
| 54 |  Italy Italy |
92 |
| 55 |  Cameroon Cameroon |
88 |
| 56 |  Turkey Turkey |
81 |
| 57 |  Denmark Denmark |
78 |
| 58 |  Tanzania Tanzania |
71 |
| 59 |  Japan Japan |
67 |
| 60 |  Congo Congo |
64 |
| 61 |  Hungary Hungary |
60 |
| 62 |  Philippines Philippines |
60 |
| 63 |  Tunisia Tunisia |
42 |
| 64 |  Mozambique Mozambique |
42 |
| 65 |  Chile Chile |
39 |
| 66 |  Ireland Ireland |
39 |
| 67 |  Cuba Cuba |
35 |
| 68 |  Croatia Croatia |
25 |
| 69 |  Gabon Gabon |
18 |
| 70 |  Austria Austria |
18 |
| 71 |  Serbia Serbia |
11 |
| 72 |  Ecuador Ecuador |
11 |
| 73 |  Czechia Czechia |
7 |
| 74 |  Jordan Jordan |
7 |
After the top four, production drops off sharply, with no country exceeding 7,500 billion cubic feet. Canada and Qatar lead the second tier, followed by a mix of LNG exporters and regional suppliers. This steep decline underscores how concentrated global supply is at the very top.
Together, those countries form the core of the global gas supply system, spanning North America, Eurasia, the Middle East, and key LNG-exporting hubs.
America’s Shale Helped Redraw the Production Map
U.S. natural gas output has roughly tripled since 2005 as hydraulic fracturing unlocked shale formations that were previously uneconomical. This surge helps explain why the U.S. stands so far ahead of other producers and why it has become central to both pipeline and LNG flows.
Recent tensions in the Middle East have disrupted natural gas infrastructure and shipping routes, particularly around the Strait of Hormuz, a key chokepoint for global energy trade.
With flows constrained, global markets are leaning more heavily on large, stable producers. This dynamic further amplifies the role of the U.S., which leads both in natural gas output and LNG export capacity.
As supply risks persist, this concentration is becoming more consequential. Countries with large, stable production, especially the U.S., are playing a growing role in balancing global energy markets and meeting LNG demand.
Learn More on the Voronoi App 
If you enjoyed today’s post, check out U.S. Natural Gas Trade with North America (1985-2024) on Voronoi.