Ranked: The World’s Household Debt by Country
See visuals like this from many other data creators on our Voronoi app. Download it for free on iOS or Android and discover incredible data-driven charts from a variety of trusted sources.
Key Takeaways
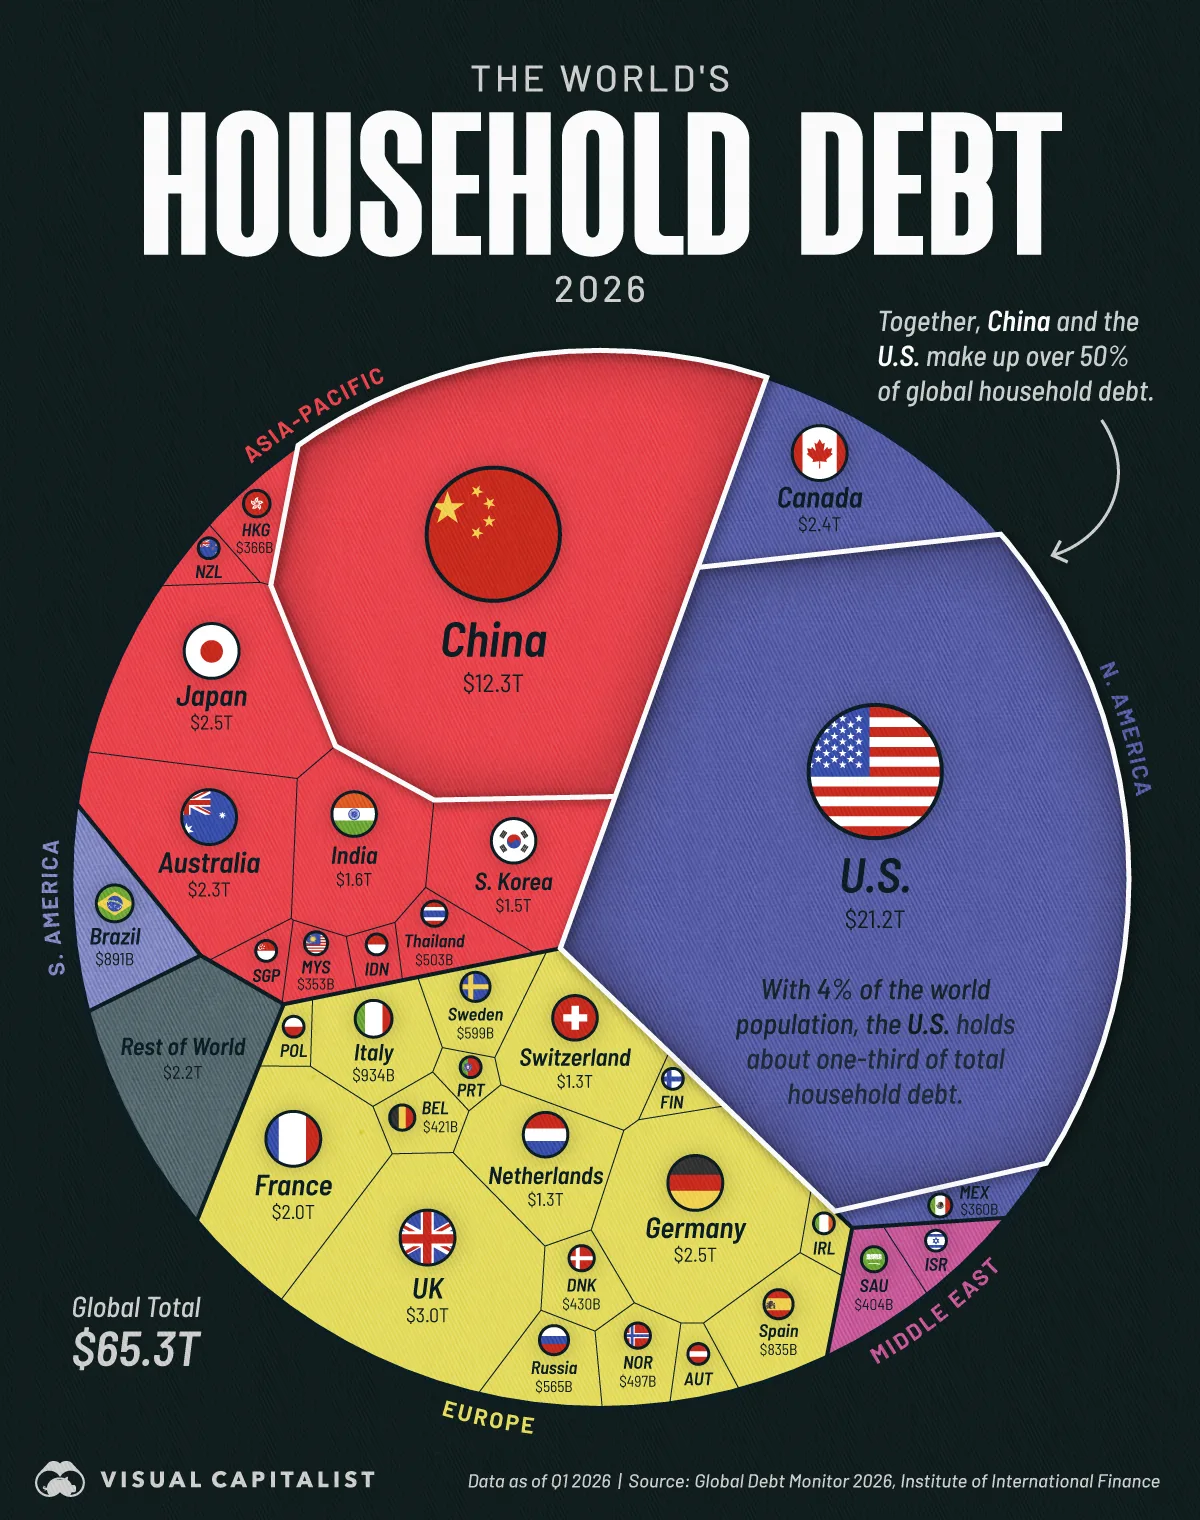
- The U.S. and China account for over half of all household debt worldwide.
- Americans hold nearly one-third of global household debt despite making up just 4% of the world’s population.
- China’s household debt has surged from $277 billion in 2006 to $12.3 trillion today.
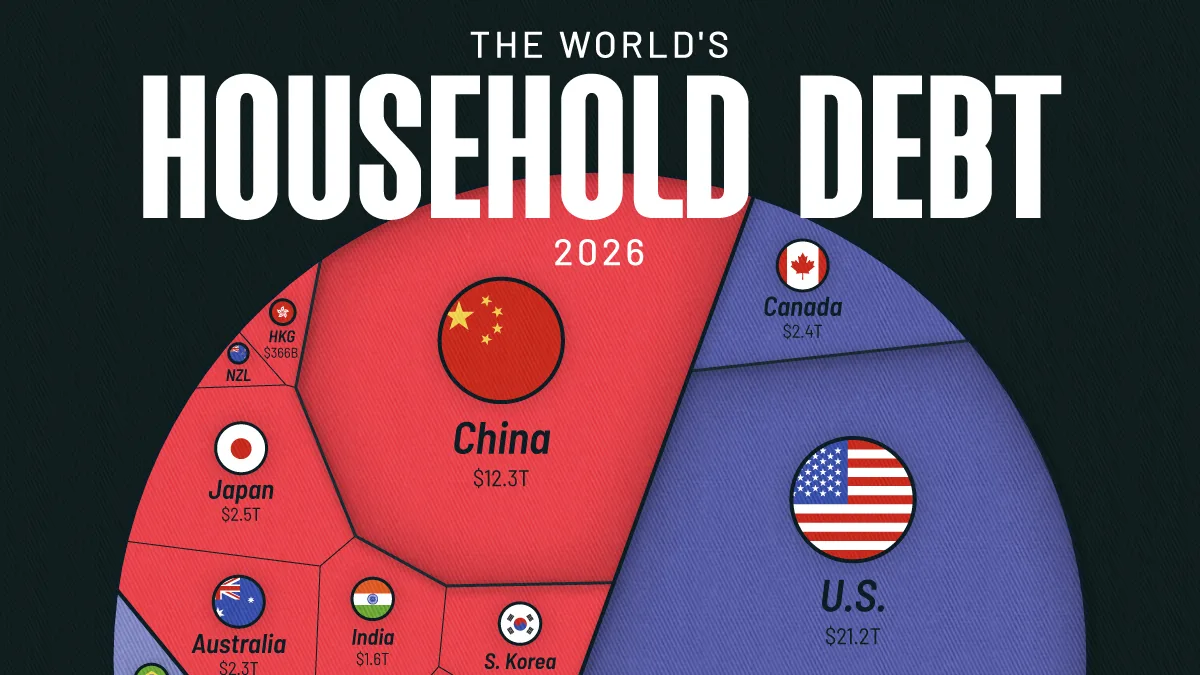
Global household debt has climbed to $65.3 trillion, with borrowing increasingly concentrated in two countries: the U.S. and China.
The U.S. alone accounts for $21.2 trillion in household debt, driven largely by mortgages, credit cards, and auto loans. China ranks second at $12.3 trillion after a decades-long credit expansion tied closely to its housing boom, according to data from the Institute of International Finance.
The data also highlights striking regional contrasts. Canada now carries nearly as much household debt as Germany despite having less than half the population, while several Asia-Pacific economies rank among the world’s most leveraged households.
America’s Outsized Debt Load
Despite having just 4% of the global population, the U.S. holds nearly one out of every three dollars of household debt worldwide. Much of this debt is tied to mortgages, reflecting high home values and the central role housing plays in the American economy.
The table below shows which countries carry the world’s largest household debt burdens and how much each contributes to the $65.3 trillion global total.
| Rank | Country | Household Debt Q1 2026 | Global Share |
|---|---|---|---|
| 1 |  U.S. U.S. |
$21.2T | 32.4% |
| 2 |  China China |
$12.3T | 18.8% |
| 3 |  UK UK |
$3.0T | 4.6% |
| 4 |  Japan Japan |
$2.5T | 3.9% |
| 5 |  Germany Germany |
$2.5T | 3.8% |
| 6 |  Canada Canada |
$2.4T | 3.6% |
| 7 |  Australia Australia |
$2.3T | 3.5% |
| 8 |  France France |
$2.0T | 3.1% |
| 9 |  India India |
$1.6T | 2.4% |
| 10 |  South Korea South Korea |
$1.5T | 2.4% |
| 11 |  Switzerland Switzerland |
$1.3T | 2.1% |
| 12 |  Netherlands Netherlands |
$1.3T | 1.9% |
| 13 |  Italy Italy |
$934B | 1.4% |
| 14 |  Brazil Brazil |
$891B | 1.4% |
| 15 |  Spain Spain |
$835B | 1.3% |
| 16 |  Sweden Sweden |
$599B | 0.9% |
| 17 |  Russia Russia |
$565B | 0.9% |
| 18 |  Thailand Thailand |
$503B | 0.8% |
| 19 |  Norway Norway |
$497B | 0.8% |
| 20 |  Denmark Denmark |
$430B | 0.7% |
| 21 |  Belgium Belgium |
$421B | 0.6% |
| 22 |  Saudi Arabia Saudi Arabia |
$404B | 0.6% |
| 23 |  Hong Kong Hong Kong |
$366B | 0.6% |
| 24 |  Mexico Mexico |
$360B | 0.6% |
| 25 |  Malaysia Malaysia |
$353B | 0.5% |
| 26 |  Israel Israel |
$287B | 0.4% |
| 27 |  Singapore Singapore |
$275B | 0.4% |
| 28 |  Austria Austria |
$247B | 0.4% |
| 29 |  New Zealand New Zealand |
$234B | 0.4% |
| 30 |  Poland Poland |
$232B | 0.4% |
| 31 |  Indonesia Indonesia |
$218B | 0.3% |
| 32 |  Finland Finland |
$200B | 0.3% |
| 33 |  Portugal Portugal |
$193B | 0.3% |
| 34 |  Ireland Ireland |
$178B | 0.3% |
| 35 |  UAE UAE |
$160B | 0.2% |
| 36 |  South Africa South Africa |
$153B | 0.2% |
| 37 |  Chile Chile |
$152B | 0.2% |
| 38 |  Türkiye Türkiye |
$151B | 0.2% |
| 39 |  Colombia Colombia |
$131B | 0.2% |
| 40 |  Czech Rep. Czech Rep. |
$128B | 0.2% |
| 41 |  Vietnam Vietnam |
$112B | 0.2% |
| 42 |  Greece Greece |
$107B | 0.2% |
| 43 |  Slovakia Slovakia |
$69B | 0.1% |
| 44 |  Luxembourg Luxembourg |
$66B | 0.1% |
| 45 |  Kuwait Kuwait |
$66B | 0.1% |
| 46 |  Kazakhstan Kazakhstan |
$57B | 0.1% |
| 47 |  Romania Romania |
$52B | 0.1% |
| 48 |  Philippines Philippines |
$51B | 0.1% |
| 49 |  Hungary Hungary |
$49B | 0.1% |
| 50 |  Peru Peru |
$45B | 0.1% |
| 51 |  Bulgaria Bulgaria |
$43B | 0.1% |
| 52 |  Nigeria Nigeria |
$41B | 0.1% |
| 53 |  Ecuador Ecuador |
$39B | 0.1% |
| 54 |  Morocco Morocco |
$37B | 0.1% |
| 55 |  Costa Rica Costa Rica |
$36B | 0.1% |
| 56 |  Argentina Argentina |
$35B | 0.1% |
| 57 |  Croatia Croatia |
$34B | 0.1% |
| 58 |  Bangladesh Bangladesh |
$29B | 0.04% |
| 59 |  Egypt Egypt |
$28B | 0.04% |
| 60 |  Oman Oman |
$26B | 0.04% |
| 61 |  Lithuania Lithuania |
$23B | 0.04% |
| 62 |  Cyprus Cyprus |
$22B | 0.03% |
| 63 |  Slovenia Slovenia |
$21B | 0.03% |
| 64 |  Dominican Republic Dominican Republic |
$19B | 0.03% |
| 65 |  Estonia Estonia |
$18B | 0.03% |
| 66 |  Serbia Serbia |
$18B | 0.03% |
| 67 |  Jordan Jordan |
$15B | 0.02% |
| 68 |  Tunisia Tunisia |
$15B | 0.02% |
| 69 |  Malta Malta |
$14B | 0.02% |
| 70 |  Kenya Kenya |
$13B | 0.02% |
| 71 |  Sri Lanka Sri Lanka |
$12B | 0.02% |
| 72 |  Bahrain Bahrain |
$12B | 0.02% |
| 73 |  Latvia Latvia |
$10B | 0.02% |
| 74 |  Trinidad and Tobago Trinidad and Tobago |
$9B | 0.01% |
| 75 |  Côte d’Ivoire Côte d’Ivoire |
$9B | 0.01% |
| 76 |  Pakistan Pakistan |
$9B | 0.01% |
| 77 |  El Salvador El Salvador |
$7B | 0.01% |
| 78 |  Tanzania Tanzania |
$7B | 0.01% |
| 79 |  Mongolia Mongolia |
$6B | 0.01% |
| 80 |  Ethiopia Ethiopia |
$6B | 0.01% |
| 81 |  Jamaica Jamaica |
$4B | 0.01% |
| 82 |  Ghana Ghana |
$4B | 0.01% |
| 83 |  Mozambique Mozambique |
$2B | 0.004% |
| 84 |  Lao PDR Lao PDR |
$2B | 0.003% |
| 85 |  Tajikistan Tajikistan |
$2B | 0.003% |
| 86 |  Zambia Zambia |
$2B | 0.003% |
| 87 |  Angola Angola |
$2B | 0.003% |
| 88 |  Rwanda Rwanda |
$2B | 0.003% |
| 89 |  Senegal Senegal |
$2B | 0.003% |
| 90 |  Cameroon Cameroon |
$2B | 0.003% |
| 91 |  Maldives Maldives |
$1B | 0.002% |
| 92 |  Papua New Guinea Papua New Guinea |
$1B | 0.002% |
| 93 |  Benin Benin |
$1B | 0.002% |
| 94 |  Congo, Rep. of Congo, Rep. of |
$1B | 0.001% |
| 95 |  Grenada Grenada |
$1B | 0.001% |
| 96 |  Gambia Gambia |
$0B | 0.0% |
Credit cards, auto loans, and student debt also contribute to America’s massive household balance sheet. In 2025, U.S. credit card balances hit a record high of nearly $1.3 trillion.
While high household debt can support economic growth and consumer spending, it also leaves households more exposed to rising interest rates and housing market downturns. As borrowing costs have climbed, debt levels have become an increasingly important measure of financial vulnerability.
China’s 40x Debt Surge
China’s household debt story is relatively new compared to mature Western credit economies. Since 2006, household debt has soared from $277 billion to $12.3 trillion. As a share of GDP, it has climbed from 11% to 60%.
In the decade leading up to 2019, household debt expanded rapidly, largely driven by a property boom. This stretched household balance sheets, with mortgage loans rising to roughly one-third of GDP by 2023. With the property market now facing a prolonged slump, the estimated number of defaults has doubled over the past five years.
One key difference is that China’s household savings rate remains relatively high. Personal savings account for roughly 35% of disposable income across urban households, providing a potential financial buffer even as debt levels rise.
Ultimately, household debt is increasingly concentrated in a small number of major economies, with the U.S. and China alone accounting for more than half of the global total. As housing markets and consumer borrowing continue to drive economic growth, these debt levels are becoming one of the clearest indicators of financial vulnerability worldwide.
Learn More on the Voronoi App 
To learn more about this topic, check out this graphic on how much people save around the world.