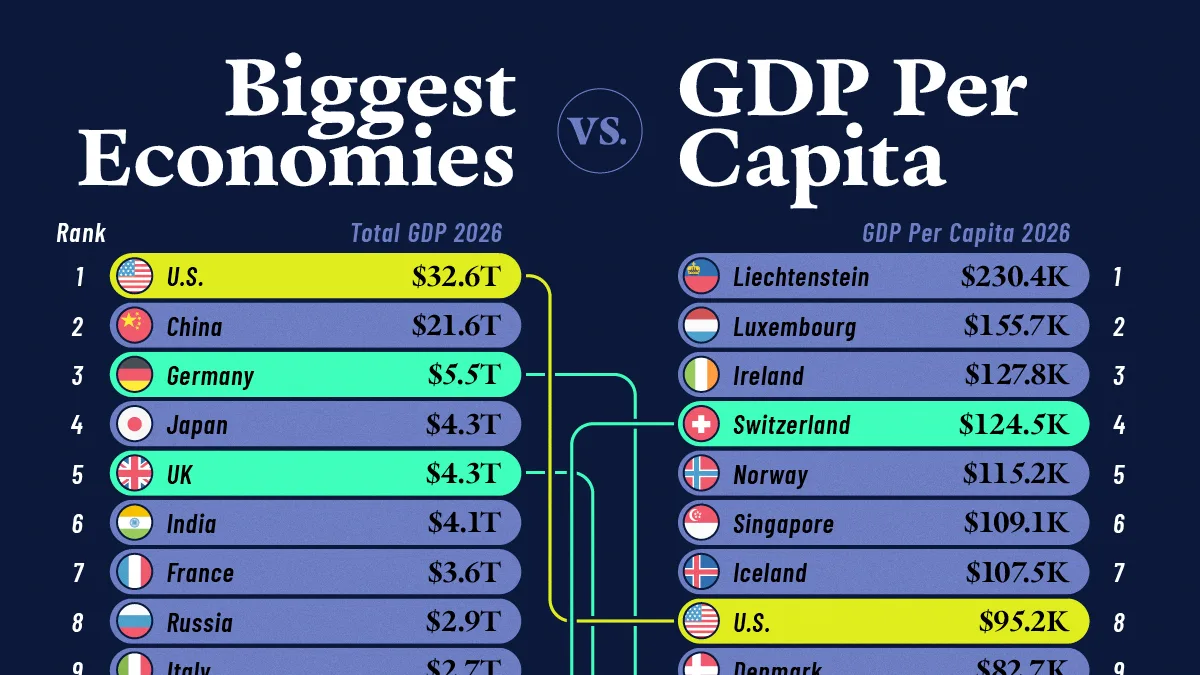
How the World’s Largest Economies Compare Per Capita
Key Takeaways
- Only nine economies appear in both the top 25 rankings for total GDP and GDP per capita in 2026.
- The United States leads in total GDP at $32.64 trillion, while Liechtenstein ranks first in GDP per capita at $230,417.
- India shows one of the sharpest contrasts, ranking sixth globally in total GDP ($4.06 trillion) but 157th in GDP per capita, at just $2,750 per person.
The world’s largest economies don’t necessarily rank highest in economic output per person.
While countries like the United States and China generate trillions of dollars in economic output, smaller economies often lead when GDP is divided by population.
This visualization compares the world’s 25 largest economies by total GDP with the 25 highest-ranking economies by GDP per capita in 2026.
The data comes from the International Monetary Fund’s World Economic Outlook (October 2026), using estimates for nominal GDP and GDP per capita in current U.S. dollars.
These figures are not adjusted for purchasing power, and GDP per capita measures economic output per resident rather than individual income.
The U.S. and China Dominate Total GDP
The United States remains the world’s largest economy in 2026, with an estimated GDP of $32.64 trillion, followed by China at $21.55 trillion. The $11.09 trillion gap between the two exceeds the entire GDP of any other economy in the rankings.
Germany ranks third at $5.47 trillion, followed by Japan ($4.34 trillion), the United Kingdom ($4.27 trillion), and India ($4.06 trillion).
| Rank | Country / Economy | Total GDP |
|---|---|---|
| 1 |  United States |
$32.64T |
| 2 |  China |
$21.55T |
| 3 |  Germany |
$5.47T |
| 4 |  Japan |
$4.34T |
| 5 |  UK |
$4.27T |
| 6 |  India |
$4.06T |
| 7 |  France |
$3.55T |
| 8 |  Russia |
$2.86T |
| 9 |  Italy |
$2.70T |
| 10 |  Brazil |
$2.65T |
| 11 |  Canada |
$2.49T |
| 12 |  South Korea |
$2.25T |
| 13 |  Mexico |
$2.18T |
| 14 |  Australia |
$2.11T |
| 15 |  Spain |
$2.09T |
| 16 |  Türkiye |
$1.82T |
| 17 |  Indonesia |
$1.48T |
| 18 |  Netherlands |
$1.42T |
| 19 |  Saudi Arabia |
$1.34T |
| 20 |  Switzerland |
$1.14T |
| 21 |  Poland |
$1.13T |
| 22 |  Taiwan |
$1.02T |
| 23 |  Belgium |
$772.70B |
| 24 |  Argentina |
$768.21B |
| 25 |  Israel |
$746.98B |
However, the rankings change considerably when GDP is measured on a per-person basis.
Smaller Economies Lead GDP Per Capita Rankings
Liechtenstein tops the GDP per capita rankings at $230,417, followed by Luxembourg ($155,733) and Ireland ($127,837). Switzerland and Norway round out the top five, each exceeding $115,000 in economic output per resident.
| Rank | Country / Economy | GDP Per Capita |
|---|---|---|
| 1 |  Liechtenstein |
$230K |
| 2 |  Luxembourg |
$156K |
| 3 |  Ireland |
$128K |
| 4 | Switzerland |
$124K |
| 5 |  Norway |
$115K |
| 6 |  Singapore |
$109K |
| 7 |  Iceland |
$107K |
| 8 | United States |
$95K |
| 9 |  Denmark |
$83K |
| 10 | Netherlands |
$79K |
| 11 |  Macao SAR |
$77K |
| 12 | Australia |
$75K |
| 13 | Israel |
$72K |
| 14 |  San Marino |
$71K |
| 15 |  Sweden |
$69K |
| 16 |  Austria |
$67K |
| 17 | Germany |
$66K |
| 18 | Belgium |
$65K |
| 19 |  Qatar |
$64K |
| 20 | United Kingdom |
$61K |
| 21 |  Hong Kong SAR |
$60K |
| 22 |  Finland |
$60K |
| 23 | Canada |
$60K |
| 24 |  United Arab Emirates |
$57K |
| 25 |  Andorra |
$54K |
Liechtenstein’s exceptionally high GDP per capita partly reflects its large cross-border workforce. Workers commuting from Switzerland and Austria contribute to its economic output without being counted among its residents.
Several other economies on the list have relatively small populations and concentrations of high-value economic activity, helping explain their elevated rankings.
Meanwhile, the United States ranks eighth at $95,212 per capita, despite having the world’s largest total GDP.
Only Nine Economies Appear on Both Lists
Just nine economies appear in both top 25 rankings: the United States, Germany, the United Kingdom, Canada, Australia, the Netherlands, Switzerland, Belgium, and Israel.
Switzerland provides one of the clearest examples of the difference between the measures, ranking 20th in total GDP but fourth in GDP per capita. Germany, meanwhile, ranks third in total economic output but 17th on a per-person basis, while Canada places 11th and 23rd, respectively.
Why GDP Doesn’t Tell the Whole Story
While total GDP and GDP per capita are important measures of economic performance, neither fully captures living standards or the cost of living.
One alternative is purchasing power parity (PPP), which adjusts for differences in price levels between countries, making economic output more comparable.
According to the IMF’s 2026 estimates, Switzerland’s nominal GDP per capita of $124,478 falls to approximately $106,940 when adjusted for PPP. Singapore shows the opposite trend, with GDP per capita rising from $109,117 to $176,930 in PPP-adjusted international dollars.
However, even PPP-adjusted GDP per capita doesn’t account for income inequality, household earnings, or the affordability of essentials like housing and healthcare. These factors also matter when assessing a country’s overall standard of living.
Learn More on the Voronoi App
If you enjoyed today’s post, check out Wealth Needed to Be in the Richest 1% by Country on Voronoi.