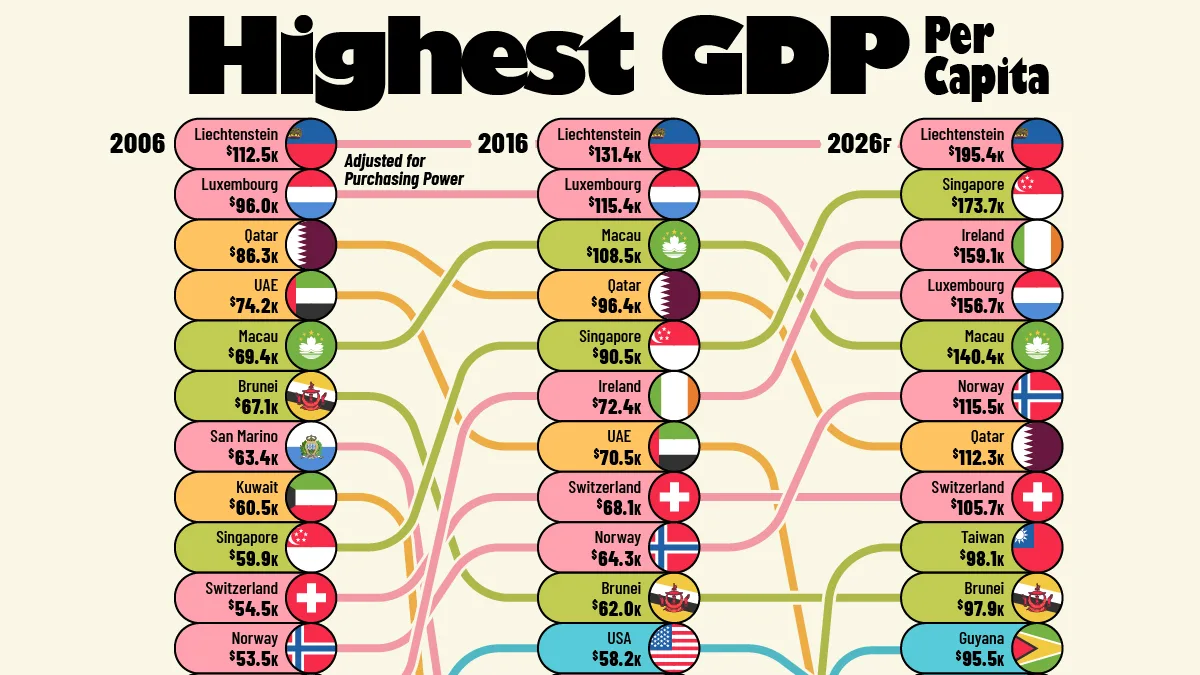
How the Richest-Country Rankings Have Changed
Key Takeaways
- Liechtenstein has had the world’s highest economic output per capita for decades, topping $195,000 in 2026 projections.
- Europe is home to many of the countries with the highest gross domestic product (GDP) per capita.
- Guyana’s GDP per capita soared to over $95,000, the highest in the Americas, following the exploitation of large oil reserves.
Measured by economic output per person, the world’s richest countries tend to be small, developed states found mostly in Europe. One South American country, though, has followed the Gulf state approach to greater riches.
This visualization ranks the countries with the highest GDP per capita in 2006, 2016, and 2026 using projections from the International Monetary Fund’s World Economic Outlook. Figures are in current prices and have been adjusted for purchasing power parity (PPP).
The Biggest Shifts in the Rankings
In 2006, Liechtenstein already stood atop global rankings, with the only GDP per capita ($112,499) to reach six figures. The small Alpine microstate was followed by nearby Luxembourg ($96,014) as well as Gulf petrostates like Qatar ($86,252) and the United Arab Emirates ($74,230).
Most of the world’s wealthiest countries by this measurement are small offshore financial hubs such as Singapore and Switzerland.
The table below ranks the world’s top 20 countries by PPP-adjusted GDP per capita in 2006.
| Rank | Country | 2006 GDP Per Capita (US $) |
|---|---|---|
| 1 |  Liechtenstein Liechtenstein |
112,499 |
| 2 |  Luxembourg Luxembourg |
96,014 |
| 3 |  Qatar Qatar |
86,252 |
| 4 |  UAE UAE |
74,230 |
| 5 |  Macau Macau |
69,437 |
| 6 |  Brunei Brunei |
67,149 |
| 7 |  San Marino San Marino |
63,401 |
| 8 |  Kuwait Kuwait |
60,477 |
| 9 |  Singapore Singapore |
59,942 |
| 10 |  Switzerland Switzerland |
54,488 |
| 11 |  Norway Norway |
53,542 |
| 12 |  Ireland Ireland |
49,519 |
| 13 |  U.S. U.S. |
46,217 |
| 14 |  Denmark Denmark |
45,064 |
| 15 |  Iceland Iceland |
44,331 |
| 16 |  Netherlands Netherlands |
43,358 |
| 17 |  Saudi Arabia Saudi Arabia |
42,595 |
| 18 |  Austria Austria |
42,341 |
| 19 |  Bahrain Bahrain |
41,276 |
| 20 |  Belgium Belgium |
40,108 |
Different countries saw their economic fortunes grow through different means. Singapore, for example, developed internationally competitive industries, including semiconductors and pharmaceuticals. Off the strength of these industries the country eventually rose to have the second-highest GDP per capita ($173,708) worldwide in 2026.
Guyana’s transformation, by contrast, began with a resource discovery that changed the country’s economic profile altogether.
How Oil Transformed Guyana
Oil production in Guyana only began in December 2019. As offshore output expanded, the impact extended beyond petroleum. Oil revenues have helped finance infrastructure and human capital programs, while public investment has supported construction and other domestic activity.
For a small economy, developing a major export industry can rapidly change output per resident. The country’s GDP per capita has grown more than anywhere else since 1990. By 2026, Guyana was projected to have a higher GDP per capita ($95,477) than any other country in the Western Hemisphere, including the United States ($94,430).
The challenge for Guyana is turning that windfall into lasting gains. Guyana has accumulated oil revenue in a Natural Resource Fund, helping balance current development needs with future savings. Investing effectively matters because oil prices can fluctuate sharply, and a higher national average does not automatically translate into better services or higher incomes for every household.
Leprechaun Economics in the 21st Century
Ireland’s climb reflects a different kind of international connection: the role of multinational companies. Profits generated by foreign-owned multinationals contribute to domestic production even when they ultimately flow to owners abroad. This can create a substantial gap between the size of the economy and the income retained by residents.
Corporate restructuring can also produce unusually large jumps. In 2015, the relocation of company balance sheets to Ireland, including intellectual property, drove a dramatic increase in reported GDP. The Irish government has even set up a parallel measurement of economic output to account for these multinational firms’ activities.
By 2026 Ireland’s GDP per capita ($159,129) is forecast to be the second-highest in Europe and third-highest worldwide.
| Rank | Country | 2026 GDP Per Capita (US $) |
|---|---|---|
| 1 | Liechtenstein |
195,372 |
| 2 | Singapore |
173,708 |
| 3 | Ireland |
159,129 |
| 4 | Luxembourg |
156,719 |
| 5 | Macau |
140,423 |
| 6 | Norway |
115,548 |
| 7 | Qatar |
112,312 |
| 8 | Switzerland |
105,680 |
| 9 |  Taiwan Taiwan |
98,051 |
| 10 | Brunei |
97,858 |
| 11 |  Guyana Guyana |
95,477 |
| 12 | USA |
94,430 |
| 13 | Denmark |
89,667 |
| 14 | UAE |
87,774 |
| 15 | Netherlands |
87,773 |
| 16 | San Marino |
87,141 |
| 17 |  Hong Kong Hong Kong |
84,212 |
| 18 | Iceland |
82,730 |
| 19 |  Malta Malta |
82,421 |
| 20 | Saudi Arabia |
78,815 |
Learn More on the Voronoi App
To zoom in on one absent continent across these rankings, check out Richest Countries in Africa by GDP Per Capita (2025) on Voronoi.