 See more visuals like this on the Voronoi app.
Ranked: The World’s Top Copper Producers (2000 vs. 2024)
See visuals like this from many other data creators on our Voronoi app. Download it for free on iOS or Android and discover incredible data-driven charts from a variety of trusted sources.
Key Takeaways
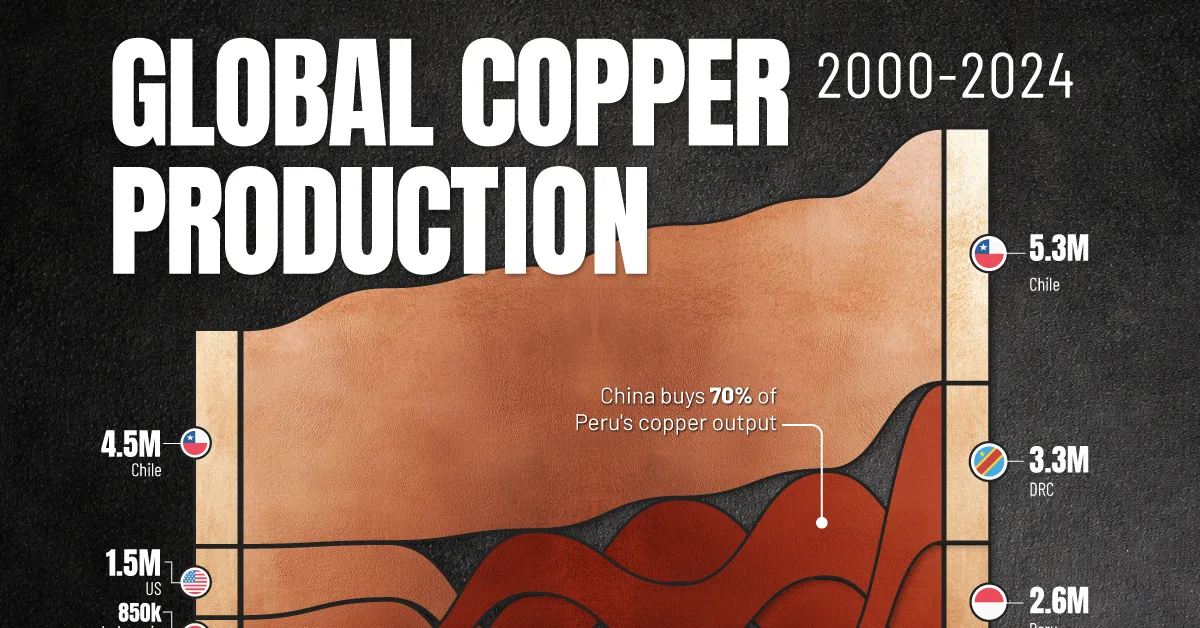
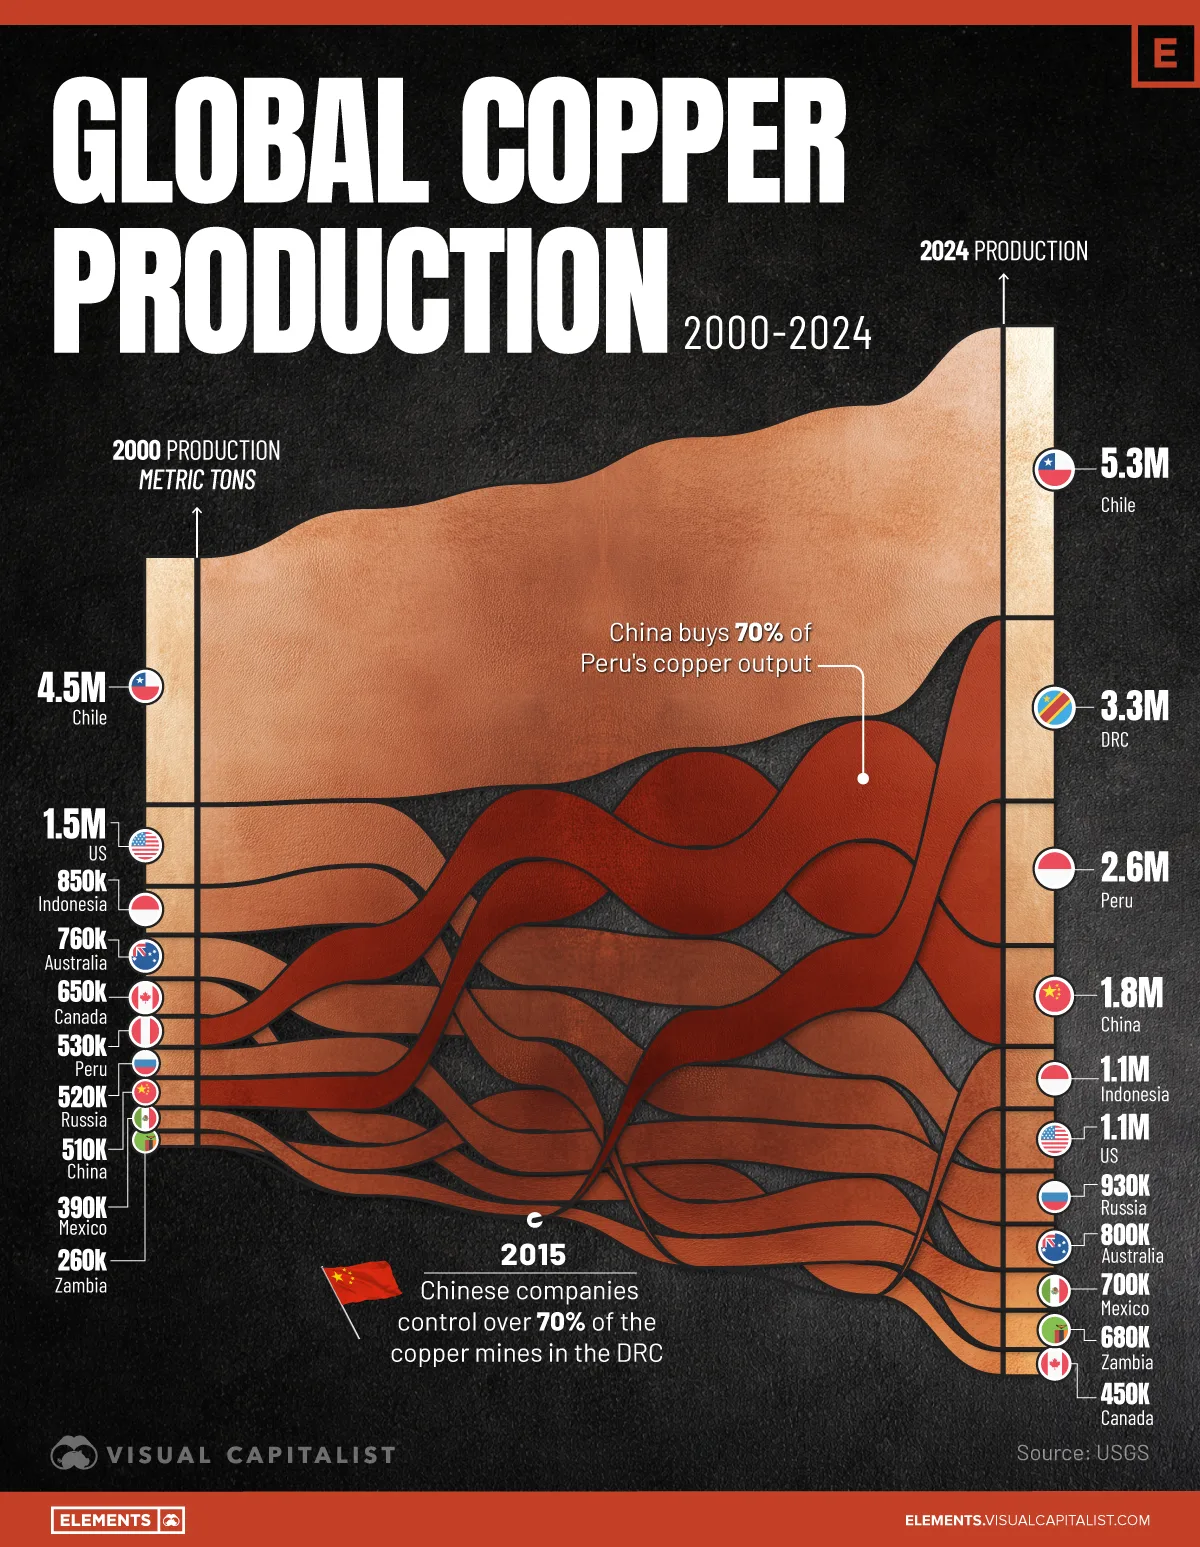
- Chile remained the world’s largest copper producer in 2024 (5.3 million tonnes), but output has been broadly flat since 2010.
- The DRC has surged into the top ranks, rising from 1.0 million tonnes in 2015 to 3.3 million tonnes of copper in 2024, which is second among countries.
- Peru and China logged some of the biggest increases since 2000: Peru grew from 0.5 to 2.6 million tonnes, while China climbed from 0.5 to 1.8 million tonnes.
Copper is one of the most critical industrial metals in the global economy, essential for power grids, electric vehicles, and renewable energy infrastructure.
This chart ranks countries based on annual copper production from 2000 to 2024 and highlights important shifts for producers like China, Peru, and the DRC. The data for this visualization comes from the U.S. Geological Survey.
China’s Domestic Production Has Grown Steadily
Since 2000, copper output in mature producers such as Chile, the United States, and Canada has largely plateaued.
In contrast, nearly all net global supply growth has come from regions where China has ownership, financing, or market leverage. Rather than competing directly in established mining regions, China positioned itself at the margins where new supply was being developed.
China’s copper production increased from roughly 510,000 tonnes in 2000 to about 1.8 million tonnes in 2024. This represents more than a threefold increase over two decades, reflecting heavy investment in domestic mining and smelting capacity.
Despite this growth, China still trails the world’s largest producers on paper, ranking behind countries like Chile and Peru in mined output.
| Country | 2000 (Million Tonnes) | 2005 | 2010 | 2015 | 2020 | 2024 |
|---|---|---|---|---|---|---|
 Chile Chile |
4.5 | 5.3 | 5.5 | 5.7 | 5.7 | 5.3 |
 Congo (Kinshasa) Congo (Kinshasa) |
— | — | — | 1 | 1.3 | 3.3 |
 Peru Peru |
0.5 | 1 | 1.3 | 1.6 | 2.2 | 2.6 |
 China China |
0.5 | 0.6 | 1.2 | 1.8 | 1.7 | 1.8 |
 United States United States |
1.5 | 1.2 | 1.1 | 1.3 | 1.2 | 1.1 |
 Indonesia Indonesia |
0.9 | 1.1 | 0.8 | — | — | 1.1 |
 Russia Russia |
0.5 | 0.7 | 0.8 | 0.7 | 0.9 | 0.9 |
 Australia Australia |
0.8 | 0.9 | 0.9 | 1 | 0.9 | 0.8 |
 Mexico Mexico |
0.4 | 0.4 | 0.2 | 0.6 | 0.7 | 0.7 |
 Zambia Zambia |
0.3 | 0.5 | 0.8 | 0.6 | 0.8 | 0.7 |
 Canada Canada |
0.7 | 0.6 | 0.5 | 0.7 | 0.6 | 0.5 |
However, focusing only on domestic production understates China’s true role in the global copper market.
Congo’s Copper Boom Is China-Aligned
The most dramatic change in global copper supply since 2000 has occurred in the Democratic Republic of Congo (DRC).
Copper production there expanded from negligible levels to roughly 3.3 million tonnes by 2024, making Congo one of the world’s largest producers. Much of this growth has been driven by Chinese state-backed firms through mine ownership, long-term concessions, and infrastructure-for-resources agreements.
While Congo’s output is officially counted as national production, a significant share of this copper is effectively controlled by Chinese companies, making it part of China-aligned supply.
Peru Strengthens China’s Grip Through Demand
Peru’s copper output grew from about 530,000 tonnes in 2000 to 2.6 million tonnes in 2024, ranking it among the top global producers.
China does not control Peru’s mining sector to the same extent as Congo’s, but it is the dominant buyer of Peruvian copper and holds stakes in key mining projects.
Learn More on the Voronoi App
If you enjoyed today’s post, check out Visualizing the Growth of Chinese Copper Miners on Voronoi, the new app from Visual Capitalist.