Ranked: U.S. States With the Widest Wage Gaps
Key Takeaways
- California has the largest wage gap, with top earners making 173% more than the median worker.
- Massachusetts records the highest wages for both top earners and median earners among all states.
- The wage gap varies widely across the country, ranging from $44,380 in Mississippi to $100,840 in California.
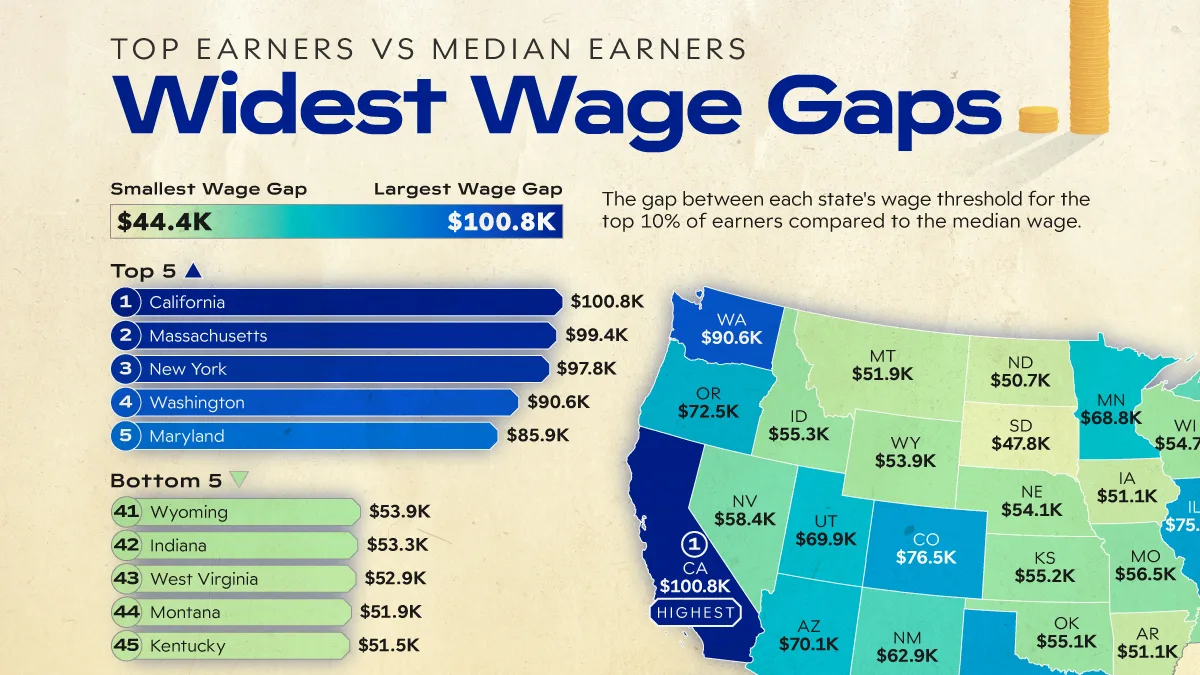
This visualization ranks all 50 states by the dollar difference between the wage threshold for the top 10% of earners and the median wage. It shows where top wages pull furthest away from typical earnings across the country.
The data for this visualization comes from the U.S. Bureau of Labor Statistics Occupational Employment and Wage Statistics (OEWS) for May 2025.
California Leads the Wage Gap Rankings
California records the widest earnings gap in the country.
Workers at the 90th percentile earn $159,080 annually, compared with a median wage of $58,240, creating a gap of $100,840. California is the only state where the difference exceeds $100,000.
| State | Top Earners | Median Earners | Earnings Gap | Top Earners Earn More By |
|---|---|---|---|---|
| California | $159,080 | $58,240 | $100,840 | 173% |
| Massachusetts | $163,010 | $63,590 | $99,420 | 156% |
| New York | $157,500 | $59,670 | $97,830 | 164% |
| Washington | $153,630 | $62,990 | $90,640 | 144% |
| Maryland | $145,410 | $59,510 | $85,900 | 144% |
| New Jersey | $142,750 | $58,570 | $84,180 | 144% |
| Virginia | $139,010 | $55,690 | $83,320 | 150% |
| Texas | $125,220 | $48,620 | $76,600 | 158% |
| Colorado | $136,330 | $59,800 | $76,530 | 128% |
| Connecticut | $135,790 | $59,690 | $76,100 | 128% |
| Illinois | $127,770 | $51,960 | $75,810 | 146% |
| Delaware | $127,690 | $52,190 | $75,500 | 145% |
| Georgia | $122,470 | $48,170 | $74,300 | 154% |
| Oregon | $129,520 | $57,000 | $72,520 | 127% |
| North Carolina | $119,640 | $47,970 | $71,670 | 149% |
| Rhode Island | $128,120 | $56,780 | $71,340 | 126% |
| New Hampshire | $126,930 | $55,880 | $71,050 | 127% |
| Arizona | $120,180 | $50,060 | $70,120 | 140% |
| Utah | $119,990 | $50,110 | $69,880 | 140% |
| Minnesota | $125,730 | $56,920 | $68,810 | 121% |
| Pennsylvania | $117,860 | $49,690 | $68,170 | 137% |
| Alaska | $128,720 | $61,000 | $67,720 | 111% |
| Hawaii | $123,660 | $56,320 | $67,340 | 120% |
| Florida | $114,550 | $47,880 | $66,670 | 139% |
| New Mexico | $110,070 | $47,210 | $62,860 | 133% |
| Michigan | $110,650 | $49,270 | $61,380 | 125% |
| Nevada | $106,080 | $47,660 | $58,420 | 123% |
| Ohio | $106,800 | $49,380 | $57,420 | 116% |
| Missouri | $104,320 | $47,800 | $56,520 | 118% |
| South Carolina | $103,010 | $46,490 | $56,520 | 122% |
| Tennessee | $103,130 | $47,380 | $55,750 | 118% |
| Alabama | $101,250 | $45,670 | $55,580 | 122% |
| Idaho | $103,240 | $47,970 | $55,270 | 115% |
| Kansas | $103,250 | $48,010 | $55,240 | 115% |
| Oklahoma | $100,690 | $45,600 | $55,090 | 121% |
| Vermont | $111,480 | $56,390 | $55,090 | 98% |
| Wisconsin | $104,990 | $50,270 | $54,720 | 109% |
| Louisiana | $100,110 | $45,520 | $54,590 | 120% |
| Nebraska | $103,110 | $48,980 | $54,130 | 111% |
| Maine | $105,510 | $51,430 | $54,080 | 105% |
| Wyoming | $104,190 | $50,270 | $53,920 | 107% |
| Indiana | $101,160 | $47,860 | $53,300 | 111% |
| West Virginia | $98,220 | $45,300 | $52,920 | 117% |
| Montana | $100,610 | $48,740 | $51,870 | 106% |
| Kentucky | $98,380 | $46,920 | $51,460 | 110% |
| Arkansas | $94,740 | $43,630 | $51,110 | 117% |
| Iowa | $99,630 | $48,540 | $51,090 | 105% |
| North Dakota | $103,160 | $52,480 | $50,680 | 97% |
| South Dakota | $94,900 | $47,080 | $47,820 | 102% |
| Mississippi | $84,500 | $40,120 | $44,380 | 111% |
The state’s concentration of high-paying industries—including technology, entertainment, finance, and biotechnology—helps push top salaries well above the national average.
At the same time, its large and diverse workforce spans many occupations with more modest pay, contributing to a wider earnings spread.
High-Wage States Dominate the Top 10
California, Massachusetts, and New York form a clear top tier, with wage gaps of nearly $98,000 or more. The gap then falls to $90,640 in fourth-ranked Washington.
Massachusetts stands out by posting the nation’s highest wages at both ends of the distribution, with top earners making $163,010 and median workers earning $63,590 annually.
Many of the highest-ranking states have strong employment in finance, healthcare, professional services, and technology. These industries tend to generate high salaries for specialized professionals while supporting a broader workforce across occupations with more modest pay.
Smaller Gaps Don’t Always Mean Higher Pay
A smaller dollar gap does not necessarily indicate greater income equality. Because this ranking measures the absolute dollar difference between two wage thresholds, states with lower wages overall can naturally produce smaller gaps.
Mississippi illustrates this clearly. Its $44,380 gap is the smallest in the country, but it also records the nation’s lowest wages for both top earners and median workers.
North Dakota and Vermont are notable exceptions. Both have relatively modest earnings gaps while maintaining median wages above many neighboring states.
Learn More on the Voronoi App 
If you enjoyed today’s post, check out Which U.S. States Have the Highest GDP per Capita on Voronoi.