Ranked: Water Supply vs. Use Per Person by Country
Key Takeaways
- Iceland has the world’s highest renewable freshwater supply per person, at 15.7 million cubic feet annually, roughly 50 times the U.S. level.
- The U.S. ranks 54th for freshwater supply per person but sixth for freshwater withdrawals.
- Guyana is one of the few countries near the top of both rankings, placing second for freshwater supply and third for withdrawals per person.
Freshwater abundance and water use tell two very different stories.
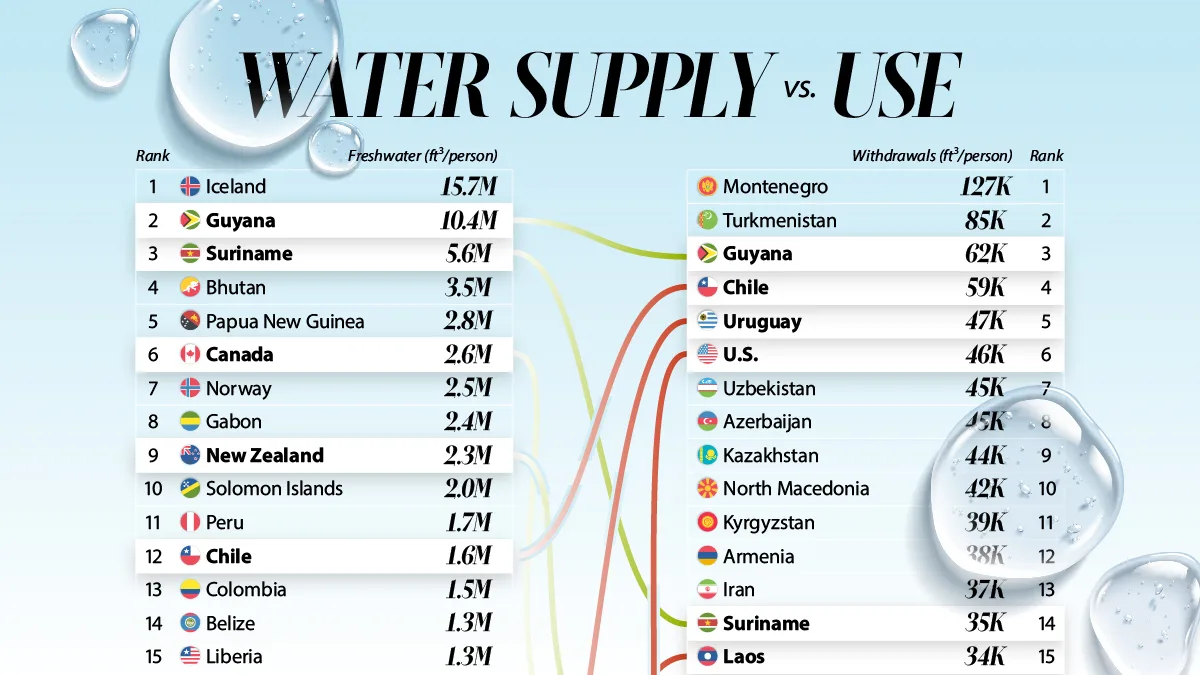
This graphic compares renewable freshwater resources with freshwater withdrawals per person, showing where water is most abundant and where the most is drawn, based on figures from Our World in Data and Statista.
Where Freshwater Is Most Abundant
Iceland stands in a category of its own, with 15.7 million cubic feet of renewable freshwater resources per person. Guyana follows at 10.4 million, while Suriname ranks third at 5.6 million.
| Rank | Country | Cubic Feet of Freshwater Per Person |
|---|---|---|
| 1 |  Iceland Iceland |
15.7M |
| 2 |  Guyana Guyana |
10.4M |
| 3 |  Suriname Suriname |
5.6M |
| 4 |  Bhutan Bhutan |
3.5M |
| 5 |  Papua New Guinea Papua New Guinea |
2.8M |
| 6 |  Canada Canada |
2.6M |
| 7 |  Norway Norway |
2.5M |
| 8 |  Gabon Gabon |
2.4M |
| 9 |  New Zealand New Zealand |
2.3M |
| 10 |  Solomon Islands Solomon Islands |
2.0M |
| 11 |  Peru Peru |
1.7M |
| 12 |  Chile Chile |
1.6M |
| 13 |  Colombia Colombia |
1.5M |
| 14 |  Belize Belize |
1.3M |
| 15 |  Liberia Liberia |
1.3M |
| 16 |  Congo Congo |
1.3M |
| 17 |  Vanuatu Vanuatu |
1.1M |
| 18 |  Fiji Fiji |
1.1M |
| 19 |  Panama Panama |
1.1M |
| 20 |  Russia Russia |
1.1M |
| 21 |  Venezuela Venezuela |
1.0M |
| 22 |  Central African Republic Central African Republic |
977K |
| 23 |  Uruguay Uruguay |
960K |
| 24 |  Brazil Brazil |
951K |
| 25 |  Laos Laos |
890K |
| 26 |  Bolivia Bolivia |
888K |
| 27 |  Ecuador Ecuador |
877K |
| 28 |  Nicaragua Nicaragua |
820K |
| 29 |  Costa Rica Costa Rica |
785K |
| 30 |  Sierra Leone Sierra Leone |
683K |
Canada, Norway, and New Zealand also rank among the top 10, each with more than two million cubic feet available per person. Many of the countries near the top combine relatively small populations with extensive rivers, lakes, heavy rainfall, or glacial systems.
Brazil shows how much population can change the ranking. Despite being home to vast freshwater resources, the country ranks 24th on a per-person basis, at 951,000 cubic feet.
The U.S. ranks 54th, with 297,000 cubic feet of renewable freshwater per person. That relatively modest ranking becomes more striking when compared with how much water the country withdraws: on the other side of the chart, the U.S. jumps to sixth.
Which Countries Draw the Most Water?
The ranking shifts sharply when looking at freshwater withdrawals. Montenegro leads at 127,000 cubic feet per person, followed by Turkmenistan at 85,000. The U.S. ranks sixth at 46,000.
| Rank | Country | Cubic Feet of Withdrawals Per Person |
|---|---|---|
| 1 |  Montenegro Montenegro |
127K |
| 2 |  Turkmenistan Turkmenistan |
85K |
| 3 | Guyana |
62K |
| 4 | Chile |
59K |
| 5 | Uruguay |
47K |
| 6 |  U.S. U.S. |
46K |
| 7 |  Uzbekistan Uzbekistan |
45K |
| 8 |  Azerbaijan Azerbaijan |
45K |
| 9 |  Kazakhstan Kazakhstan |
44K |
| 10 |  North Macedonia North Macedonia |
42K |
| 11 |  Kyrgyzstan Kyrgyzstan |
39K |
| 12 |  Armenia Armenia |
38K |
| 13 |  Iran Iran |
37K |
| 14 | Suriname |
35K |
| 15 | Laos |
34K |
| 16 |  Tajikistan Tajikistan |
34K |
| 17 |  Greece Greece |
34K |
| 18 |  Iraq Iraq |
34K |
| 19 | New Zealand |
34K |
| 20 | Canada |
33K |
| 21 |  Estonia Estonia |
32K |
| 22 |  Eswatini Eswatini |
31K |
| 23 |  Timor-Leste Timor-Leste |
30K |
| 24 |  Argentina Argentina |
29K |
| 25 |  Vietnam Vietnam |
29K |
| 26 |  Dominican Republic Dominican Republic |
29K |
| 27 |  Saudi Arabia Saudi Arabia |
29K |
| 28 |  Libya Libya |
29K |
| 29 | Venezuela |
28K |
| 30 |  Thailand Thailand |
28K |
For Americans, that high ranking has less to do with what comes out of the kitchen faucet than with the systems behind everyday life.
U.S. farms withdrew an average 105 billion gallons of water per day for crop irrigation from 2010 to 2020, while power plants withdrew another 83 billion gallons of freshwater daily.
Importantly, withdrawals are not the same as consumption. Power plants return most of the water they withdraw, while irrigation consumes a much larger share.
Why Water Abundance Isn’t the Whole Story
Geography shapes much of the renewable water a country has available, while agriculture, industry, energy production, and population help determine how much it withdraws.
That distinction becomes more important as growing cities, farms, data centers, factories, and power systems compete for water in the same places. Even water-rich countries can face local pressure when demand is concentrated, while relatively small increases in demand can matter more in drier countries.
Learn More on the Voronoi App
To learn more about this topic, check out this graphic on the world’s largest agricultural economies.
- Source: https://www.visualcapitalist.com/ranked-countries-with-the-highest-water-supply-and-use-per-person/