Ranked: Where Emissions Are Rising Fastest
See visuals like this from many other data creators on our Voronoi app. Download it for free on iOS or Android and discover incredible data-driven charts from a variety of trusted sources.
Key Takeaways
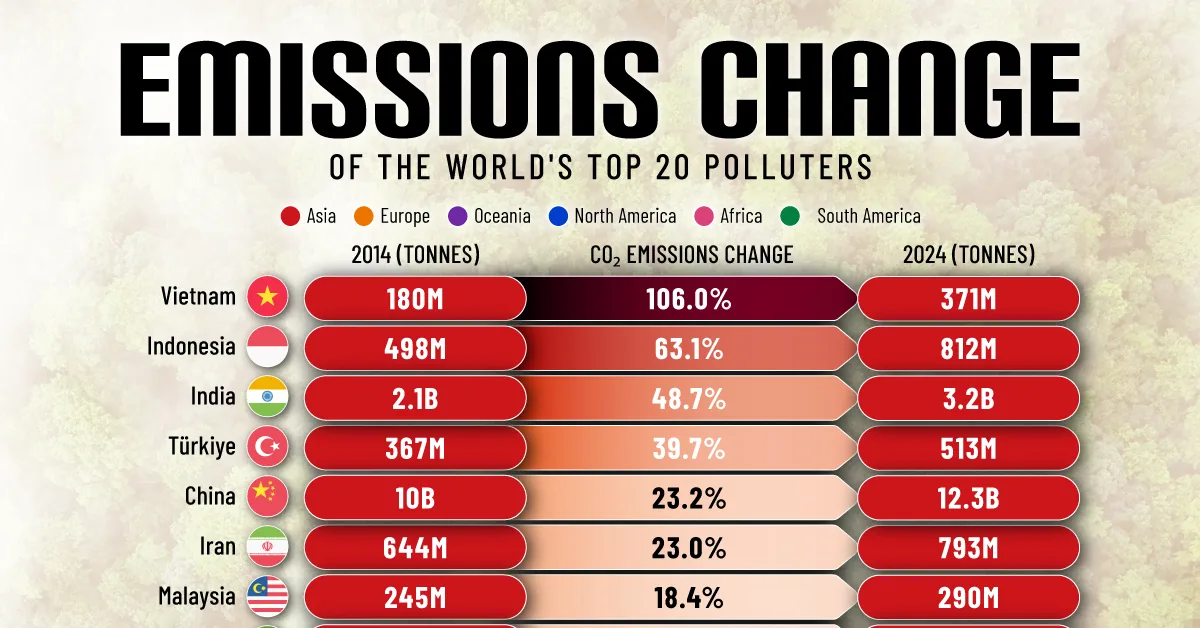
- Vietnam recorded the fastest emissions growth among major emitters, with CO₂ output rising 106% from 2014 to 2024.
- Indonesia and India also saw steep increases, underscoring how emissions growth is concentrated in fast-growing Asian economies.
- Meanwhile, the UK, Germany, and Japan cut emissions by over 20%, marking some of the largest declines globally.
Global emissions are still rising—but the increase is highly uneven.
Over the past decade, the fastest growth has come from rapidly industrializing economies. Vietnam more than doubled its emissions from 2014 to 2024, while Indonesia and India also posted steep gains as energy demand surged.
Meanwhile, several advanced economies have moved in the opposite direction. Countries like the UK, Germany, and Japan have significantly reduced their carbon output, largely by phasing out coal and expanding renewable energy.
Using data from the Global Carbon Budget via Our World in Data, this graphic ranks the world’s largest emitters by how their fossil fuel and industrial CO₂ emissions changed from 2014 to 2024.
Together, these countries account for roughly 80% of global emissions.
Emissions Change Among the World’s Top 20 Emitters
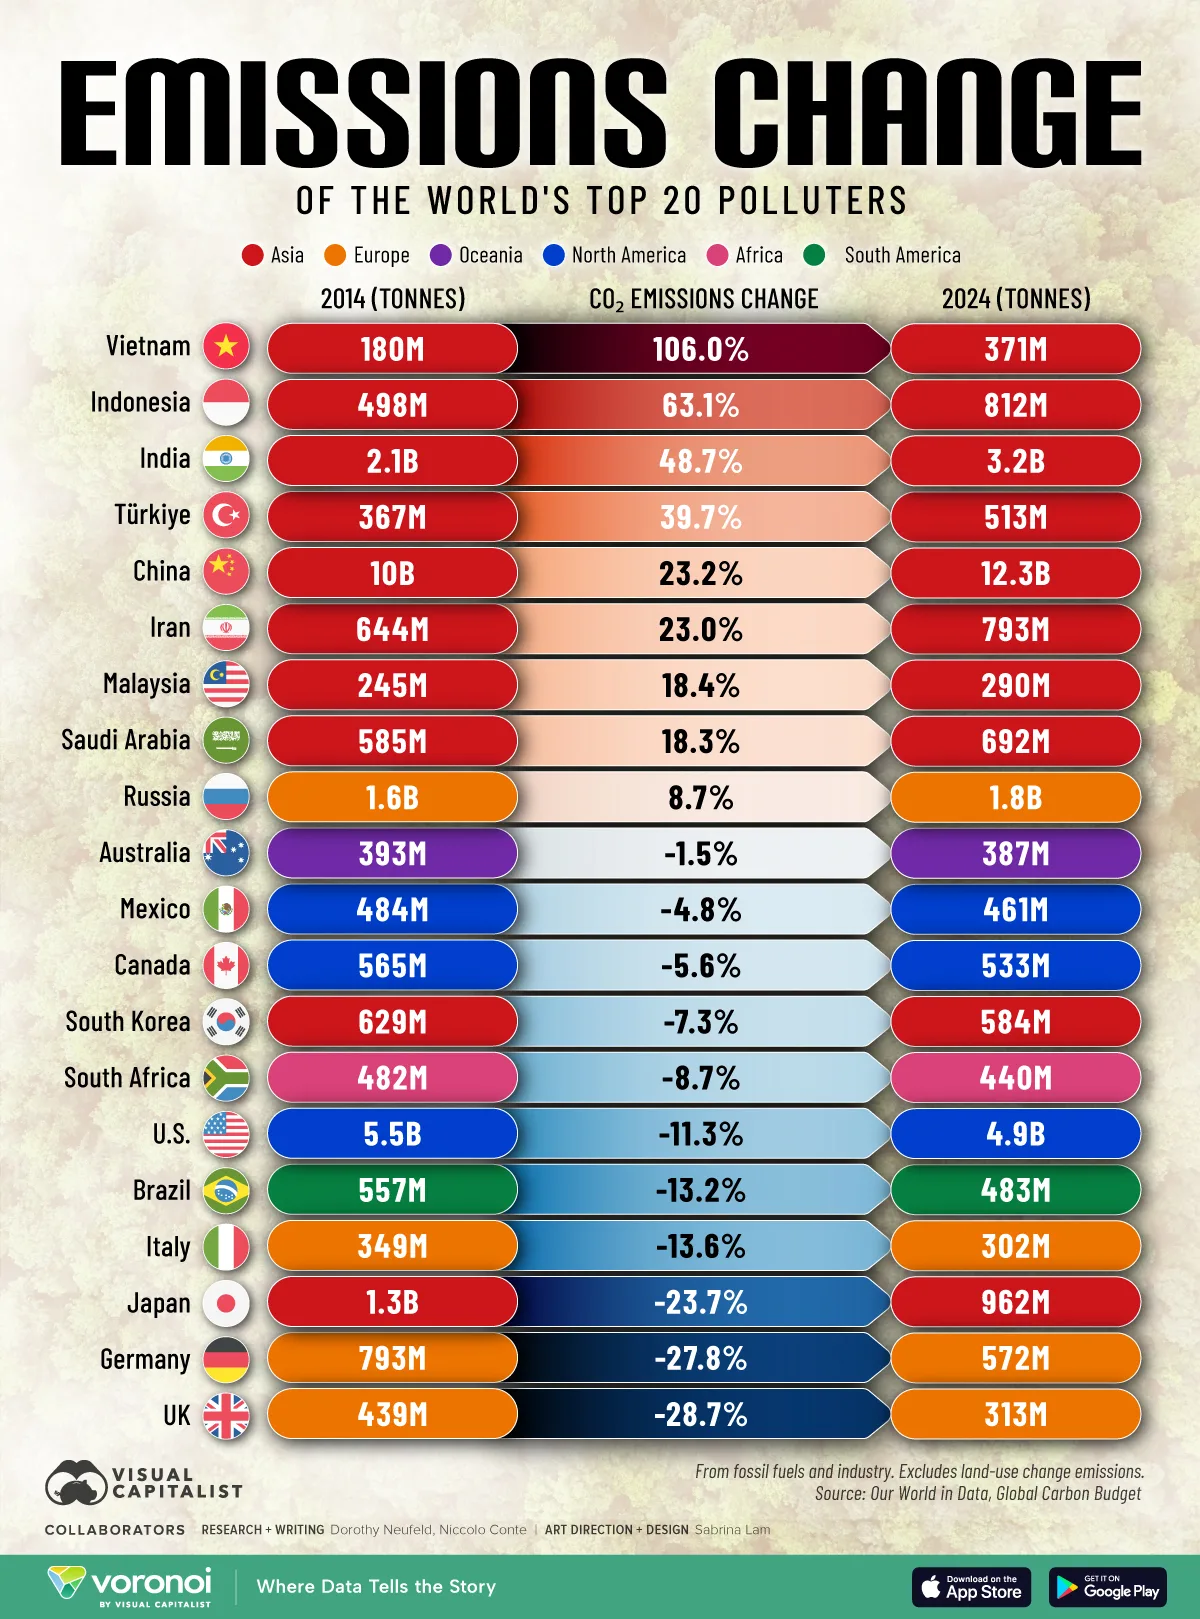
This table shows the world’s 20 largest emitters and how their carbon output has shifted over the last decade. Figures represent carbon emissions from fossil fuels and industry and exclude land-use change emissions.
| Rank | Country | CO₂ Emissions 2014 (Tonnes) |
CO₂ Emissions 2024 (Tonnes) |
Change (2014-2024) |
|---|---|---|---|---|
| 1 |  Vietnam Vietnam |
180M | 371M | 106.0% |
| 2 |  Indonesia Indonesia |
498M | 812M | 63.1% |
| 3 |  India India |
2.1B | 3.2B | 48.7% |
| 4 |  Türkiye Türkiye |
367M | 513M | 39.7% |
| 5 |  China China |
10B | 12.3B | 23.2% |
| 6 |  Iran Iran |
644M | 793M | 23.0% |
| 7 |  Malaysia Malaysia |
245M | 290M | 18.4% |
| 8 |  Saudi Arabia Saudi Arabia |
585M | 692M | 18.3% |
| 9 |  Russia Russia |
1.6B | 1.8B | 8.7% |
| 10 |  Australia Australia |
393M | 387M | -1.5% |
| 11 |  Mexico Mexico |
484M | 461M | -4.8% |
| 12 |  Canada Canada |
565M | 533M | -5.6% |
| 13 |  South Korea South Korea |
629M | 584M | -7.3% |
| 14 |  South Africa South Africa |
482M | 440M | -8.7% |
| 15 |  U.S. U.S. |
5.5B | 4.9B | -11.3% |
| 16 |  Brazil Brazil |
557M | 483M | -13.2% |
| 17 |  Italy Italy |
349M | 302M | -13.6% |
| 18 |  Japan Japan |
1.3B | 962M | -23.7% |
| 19 |  Germany Germany |
793M | 572M | -27.8% |
| 20 |  UK UK |
439M | 313M | -28.7% |
Among the world’s largest emitters, the fastest increases are concentrated in Asia. Vietnam (+106%) leads by a wide margin, followed by Indonesia (+63.1%) and India (+48.7%).
At the same time, several advanced economies have sharply reduced emissions. The UK (-28.7%), Germany (-27.8%), and Japan (-23.7%) saw the largest declines over the decade.
Together, these trends highlight a growing divide: emissions are rising fastest in emerging economies, while many developed nations are cutting output.
The Giants: China vs. the U.S.
When looking at absolute volume, the sheer scale of the world’s two largest emitters—China and the U.S.—continues to dictate the global climate trajectory.
China’s emissions rose by 23.2%—an increase of 2.3 billion tonnes since 2014. This surge alone outweighs the total annual output of most other major nations combined. In contrast, the U.S. saw an 11.3% decline, dropping to 4.9 billion tonnes, primarily driven by a sharp drop in coal consumption.
India stands as the world’s third-largest emitter, with its carbon footprint ballooning 48.7% over the decade. However, more promisingly, emissions grew at their slowest pace in two decades in 2025 (excluding the 2020 pandemic), up just 0.7% thanks to record growth in clean energy.
As global manufacturing and energy demand continue to shift toward emerging markets, future emissions trends will depend increasingly on how quickly these economies scale lower-carbon energy sources.
Learn More on the Voronoi App 
To learn more about this topic, check out this graphic on the share of global carbon emissions by country.