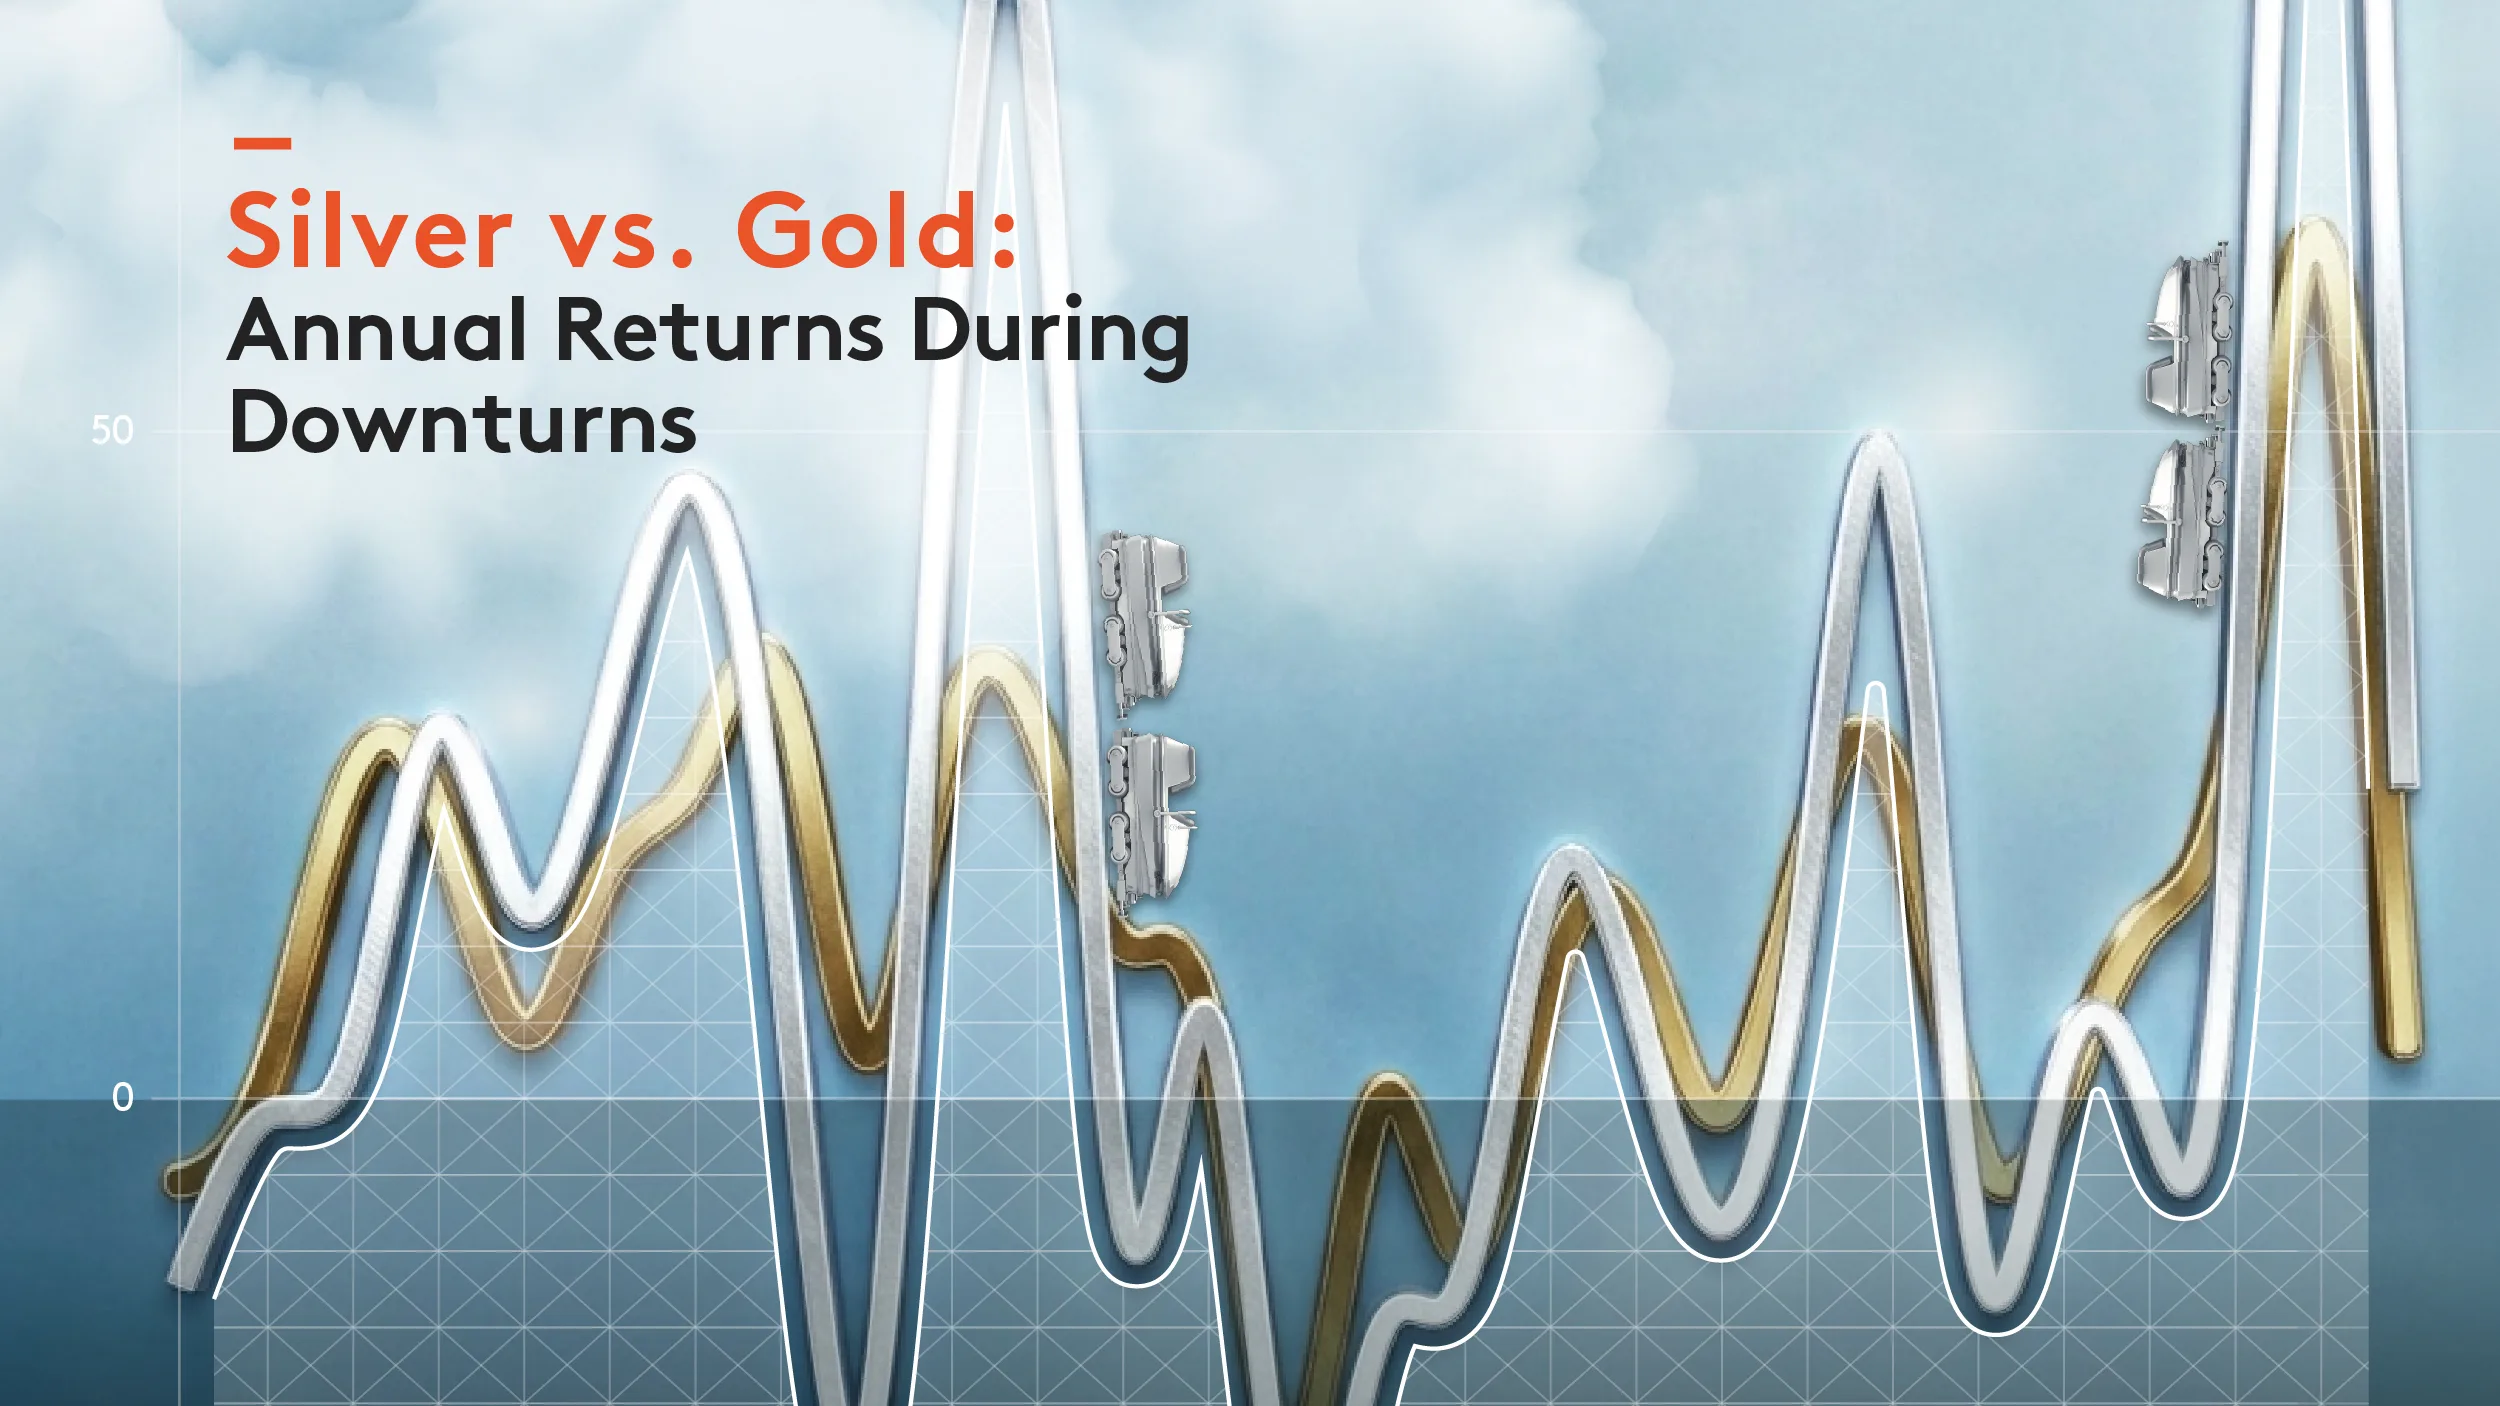


Silver vs. Gold: Annual Returns During Downturns
Key Takeaways
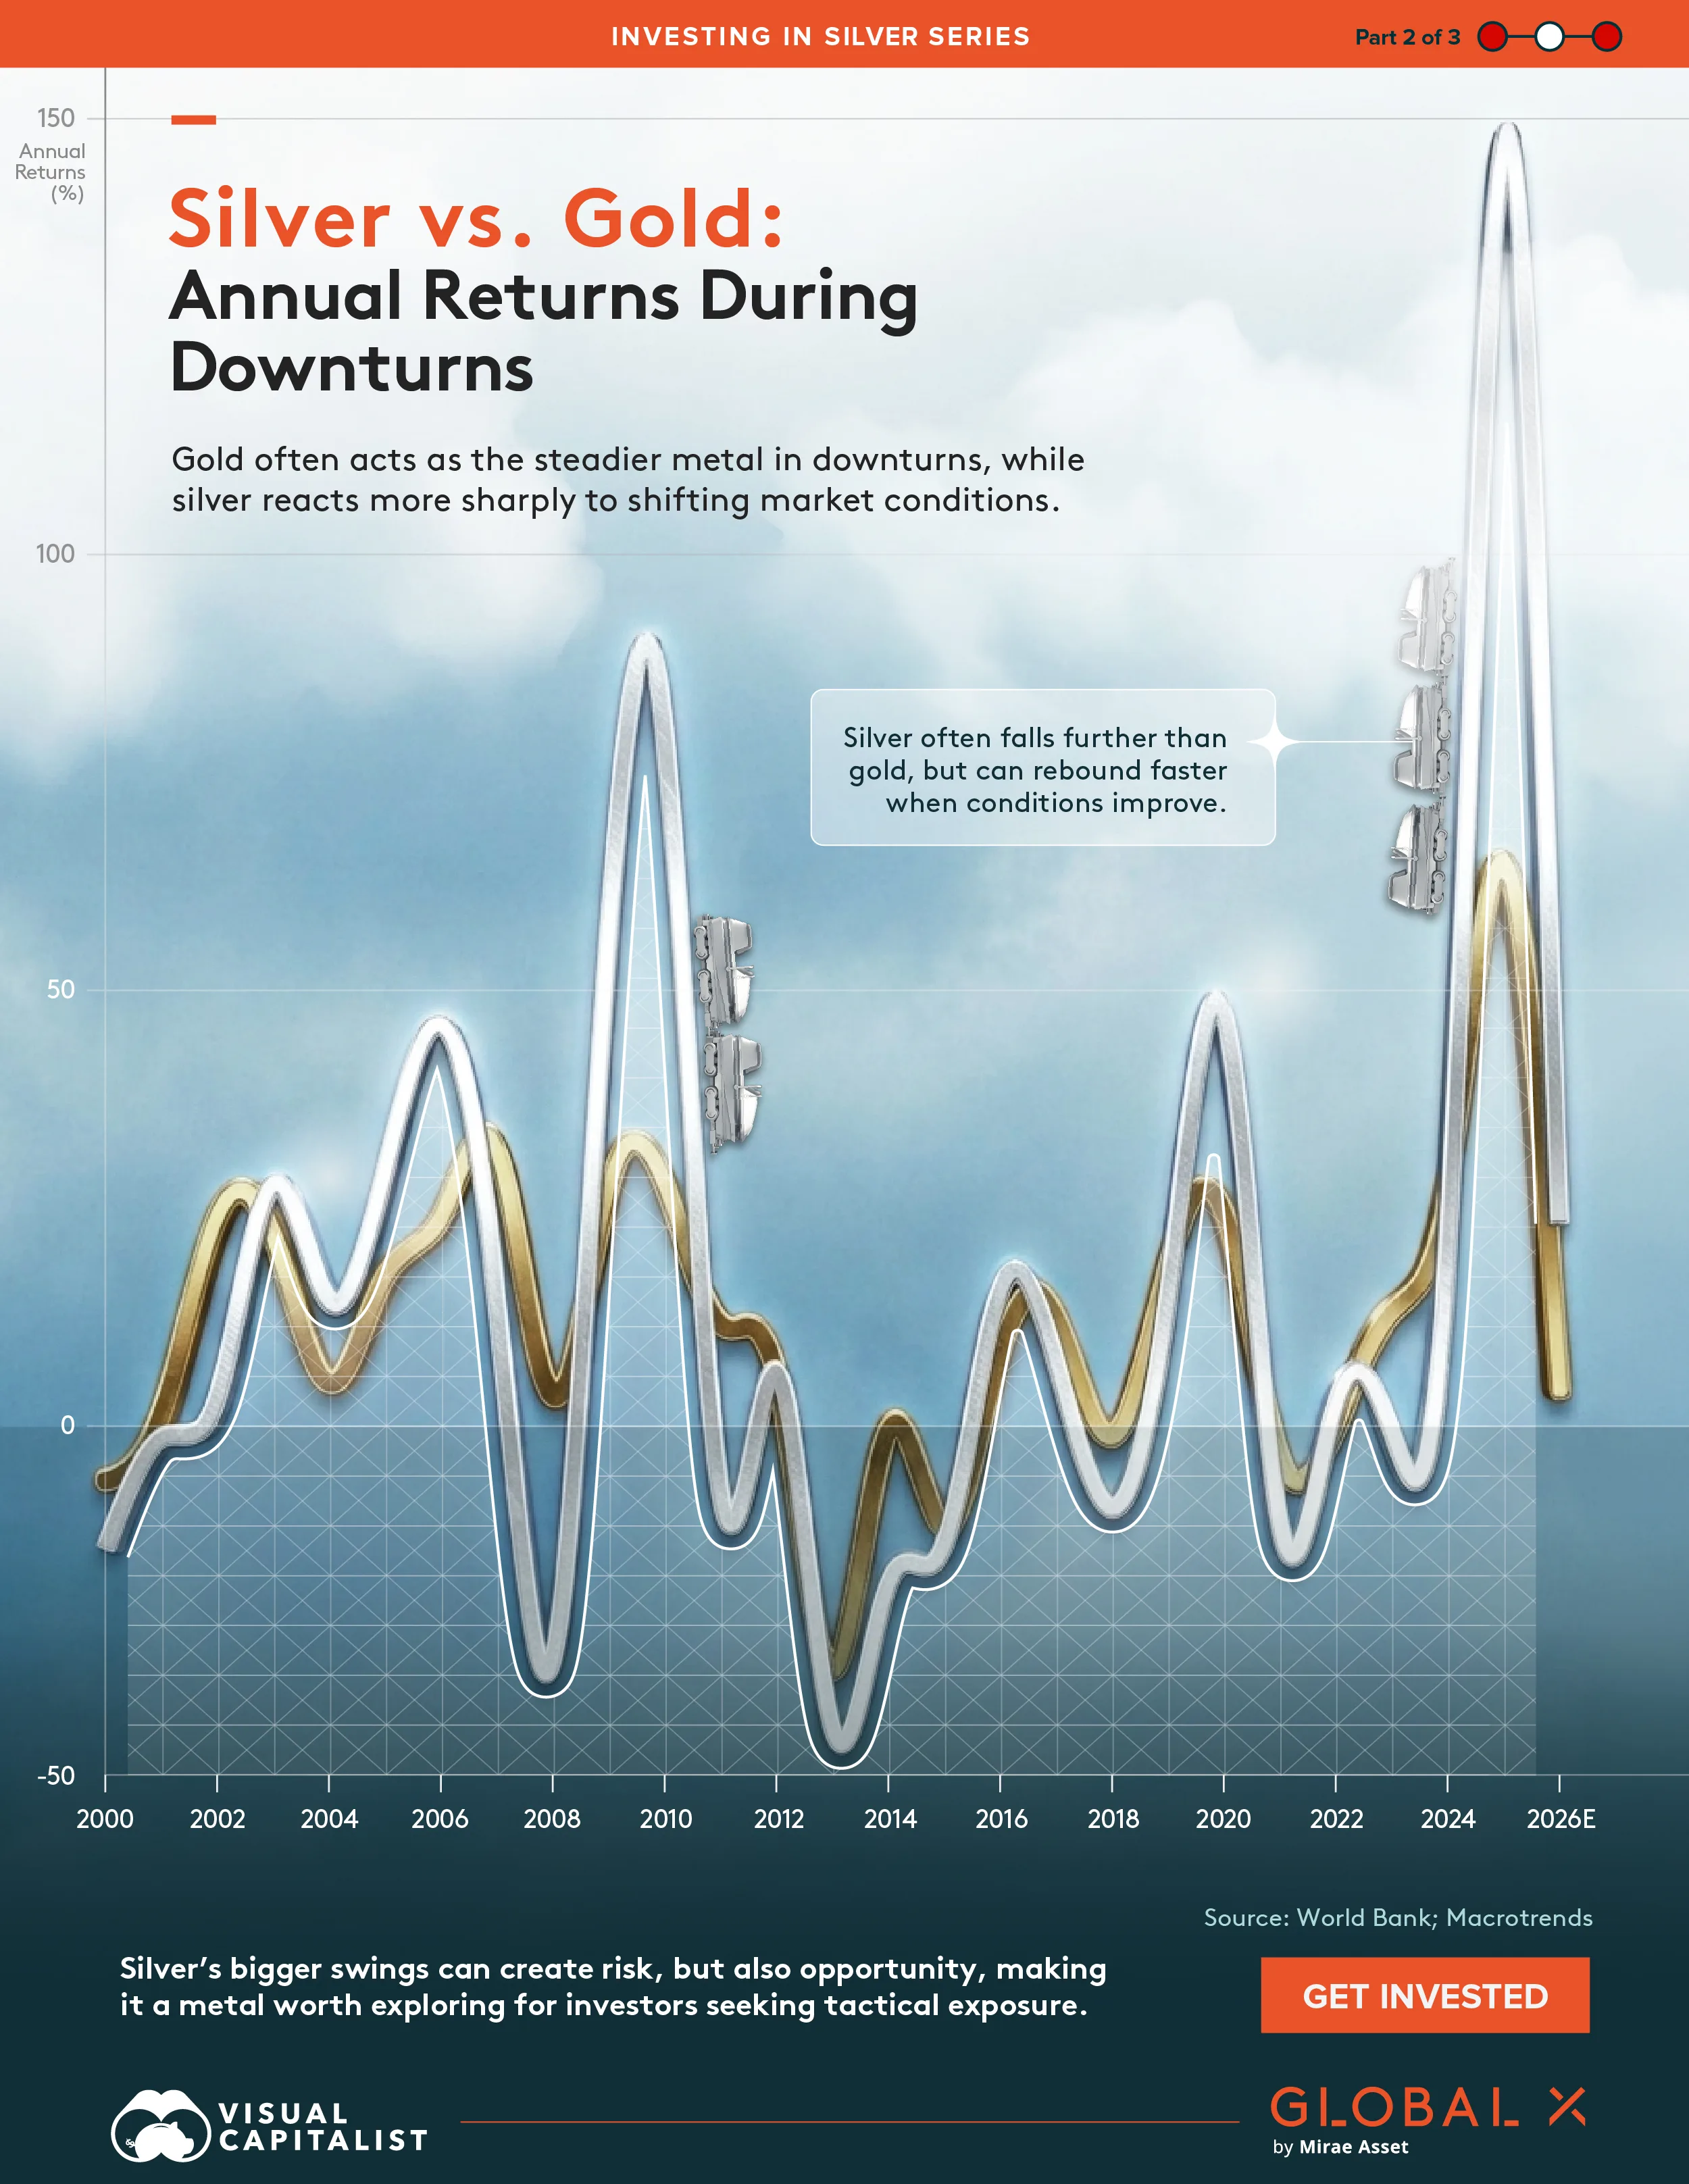
- Silver had an annual return of 148% versus gold’s 65% in 2025, showing how much more volatile silver can be during periods of market stress.
- During the 2008 downturn, gold rose 3.4% while silver fell 26.9%, but silver rebounded by 57.5% in 2009 and 80.3% in 2010 as conditions improved.
Silver has historically experienced greater volatility than gold during recessions and market downturns. In 2008, for example, gold rose 3.4% while silver fell 26.9%, before silver rebounded 57.5% in 2009 and 80.3% in 2010.
Gold and silver are both precious metals, but the data shows they can behave very differently under stress. Gold tends to act as the steadier metal, while silver reacts more sharply as investor sentiment and industrial demand shift.
This graphic, in partnership with Global X Canada, is the second of three graphics in the Investing in Silver series. It compares annual gold and silver returns during recession and downturn periods using data from the World Bank and Macrotrends.
Mexico Leads with the Most Silver Production
Silver has historically shown larger moves than gold in both directions. In 2025, silver surged nearly 150%, more than doubling gold’s 65% gain.
| Year | Gold Returns (%) | Silver Returns (%) |
|---|---|---|
| 2000 | -6.26 | -14.07 |
| 2001 | 1.41 | -1.31 |
| 2002 | 23.96 | 3.32 |
| 2003 | 21.74 | 27.84 |
| 2004 | 4.97 | 14.24 |
| 2005 | 17.12 | 29.47 |
| 2006 | 23.92 | 46.09 |
| 2007 | 31.59 | 14.42 |
| 2008 | 3.41 | -26.9 |
| 2009 | 27.63 | 57.46 |
| 2010 | 27.74 | 80.28 |
| 2011 | 11.65 | -8 |
| 2012 | 5.68 | 6.28 |
| 2013 | -27.79 | -34.89 |
| 2014 | -0.19 | -18.1 |
| 2015 | -11.59 | -13.59 |
| 2016 | 8.63 | 15.86 |
| 2017 | 12.57 | 7.12 |
| 2018 | -1.15 | -9.4 |
| 2019 | 18.83 | 15.36 |
| 2020 | 24.43 | 47.44 |
| 2021 | -3.51 | -11.55 |
| 2022 | -0.23 | 2.64 |
| 2023 | 13.08 | -0.72 |
| 2024 | 27.23 | 21.36 |
| 2025 | 64.69 | 148.14 |
| 2026 | 4.13 | 23.32 |
Source: Macrotrends
Silver’s spikes have also followed by sharp reversals. In 2008, silver fell 26.9% while gold rose 3.4%, showing gold’s relative resilience during the global financial crisis.
And yet, silver rebounded strongly in the recovery years that followed, rising 57.5% in 2009 and 80.3% in 2010.
A Higher-Beta Precious Metal
Silver’s sharper moves reflect its dual role as both a precious metal and an industrial input. When markets weaken, silver can be pressured by slowing industrial demand. But when conditions improve, it can rebound quickly as both investor demand and industrial activity recover.
This matters because silver’s volatility can create larger drawdowns, but also larger price movements. For investors, that makes silver a more tactical precious metals exposure than gold.
Investing in Silver
As demand grows from solar, electrification, and industrial applications, silver remains a key metal to watch for investors tracking long-term supply and demand trends.
Global X Canada’s ETFs can help investors access commodities without choosing individual miners.
To learn more, explore the Global X Silver Miners Index ETF (SLVX).

See how SILVX offers potential upside through rising prices and operational growth within the silver sector.
Commissions, management fees, and expenses all may be associated with an investment in products (the “Global X Funds”) managed by Global X Investments Canada Inc. The Global X Funds are not guaranteed, their values change frequently and past performance may not be repeated. Certain Global X Funds may have exposure to leveraged investment techniques that magnify gains and losses which may result in greater volatility in value and could be subject to aggressive investment risk and price volatility risk. Such risks are described in the prospectus. The prospectus contains important detailed information about the Global X Funds. Please read the relevant prospectus before investing.
Certain statements may constitute a forward-looking statement, including those identified by the expression “expect” and similar expressions (including grammatical variations thereof). The forward-looking statements are not historical facts but reflect the author’s current expectations regarding future results or events. These forward-looking statements are subject to a number of risks and uncertainties that could cause actual results or events to differ materially from current expectations. These and other factors should be considered carefully and readers should not place undue reliance on such forward-looking statements. These forward-looking statements are made as of the date hereof and the authors do not undertake to update any forward-looking statement that is contained herein, whether as a result of new information, future events or otherwise, unless required by applicable law.
This communication is intended for informational purposes only and does not constitute an offer to sell or the solicitation of an offer to purchase investment products (the “Global X Funds”) managed by Global X Investments Canada Inc. and is not, and should not be construed as, investment, tax, legal or accounting advice, and should not be relied upon in that regard. Individuals should seek the advice of professionals, as appropriate, regarding any particular investment. Investors should consult their professional advisors prior to implementing any changes to their investment strategies. These investments may not be suitable to the circumstances of an investor.
All comments, opinions and views expressed are generally based on information available as of the date of publication and should not be considered as advice to purchase or to sell mentioned securities. Before making any investment decision, please consult your investment advisor or advisors.
Global X Investments Canada Inc. (“Global X”) is a wholly owned subsidiary of Mirae Asset Global Investments Co., Ltd. (“Mirae Asset”), the Korea-based asset management entity of Mirae Asset Financial Group. Global X is a corporation existing under the laws of Canada and is the manager, investment manager and trustee of the Global X Funds.
-
 Economy5 days ago
What are the Largest Commodity Companies in North America
See the largest commodity companies in North America by market cap and production, led by ExxonMobil’s dominance in oil and gas.
-
 Economy3 weeks ago
Charted: How Many Years of Supply Life Are Left for Commodities?
Rare earth metals have lost the most supply life in the last five years from 2020 to 2025. How much supply is left for other commodities?
-
 Mining1 month ago
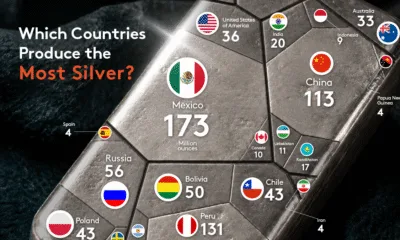
Ranked: Which Countries Produce the Most Silver?
Mexico is the leading silver producer with 20% of global production in 2025, the most silver produced of any country. Which country follows?
-
 Space2 months ago
The Largest Public Space Companies by Country
Rocket Lab leads the public pure-play space companies, with a C$71.4 billion market cap exceeding the next five companies combined.
-

 Space2 months ago
Who Owns the Most Satellites?
SpaceX has the most operational satellites in the world, with Starlink’s scale showing how commercial networks now shape orbital infrastructure.
-
 Economy2 months ago
The Fastest Growing Space Economy Sectors by 2035
The space economy is set to reach C$2.5T by 2035, with supply chains, food, and defense leading growth in space-enabled industries.