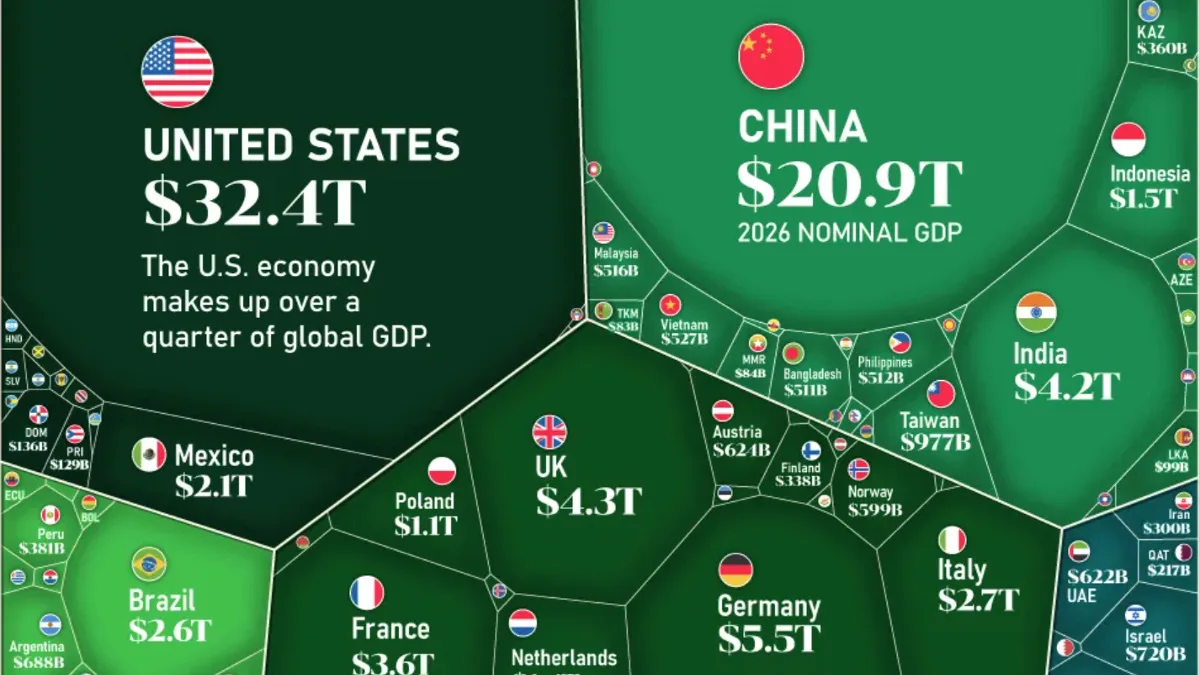
The $126T Global Economy in One Giant Chart
See visuals like this from many other data creators on our Voronoi app. Download it for free on iOS or Android and discover incredible data-driven charts from a variety of trusted sources.
Key Takeaways
- The global economy is projected to hit $126 trillion in 2026.
- Just four countries generate half of global GDP.
- The U.S. alone makes up over a quarter of global output.
The global economy is expected to reach $126 trillion in 2026, but that output is highly concentrated.
Just four countries—the United States, China, Germany, and Japan—generate roughly half of all economic activity worldwide.
This graphic visualizes the full global economy using IMF projections from the April 2026 World Economic Outlook, breaking down nearly 200 countries by their share of nominal GDP.
Half of Global GDP Comes From Just Four Countries
The U.S., China, Germany, and Japan together produce over $63 trillion in output—roughly equal to the rest of the world combined.
The table below lists all of the world’s economies as of 2026, ranked in descending order by size.
| Rank | Country | 2026 GDP (billions $) | Share |
|---|---|---|---|
| 1 |  United States United States |
32,384 | 25.6% |
| 2 |  China China |
20,852 | 16.5% |
| 3 |  Germany Germany |
5,453 | 4.3% |
| 4 |  Japan Japan |
4,379 | 3.5% |
| 5 |  United Kingdom United Kingdom |
4,265 | 3.4% |
| 6 |  India India |
4,153 | 3.3% |
| 7 |  France France |
3,596 | 2.8% |
| 8 |  Italy Italy |
2,738 | 2.2% |
| 9 |  Russia Russia |
2,656 | 2.1% |
| 10 |  Brazil Brazil |
2,636 | 2.1% |
| 11 |  Canada Canada |
2,507 | 2.0% |
| 12 |  Australia Australia |
2,124 | 1.7% |
| 13 |  Mexico Mexico |
2,121 | 1.7% |
| 14 |  Spain Spain |
2,091 | 1.7% |
| 15 |  South Korea South Korea |
1,931 | 1.5% |
| 16 |  Turkey Turkey |
1,640 | 1.3% |
| 17 |  Indonesia Indonesia |
1,540 | 1.2% |
| 18 |  Netherlands Netherlands |
1,450 | 1.1% |
| 19 |  Saudi Arabia Saudi Arabia |
1,389 | 1.1% |
| 20 |  Switzerland Switzerland |
1,147 | 0.9% |
| 21 |  Poland Poland |
1,134 | 0.9% |
| 22 |  Taiwan Taiwan |
977 | 0.8% |
| 23 |  Ireland Ireland |
779 | 0.6% |
| 24 |  Belgium Belgium |
777 | 0.6% |
| 25 |  Sweden Sweden |
760 | 0.6% |
| 26 |  Israel Israel |
720 | 0.6% |
| 27 |  Argentina Argentina |
688 | 0.5% |
| 28 |  Singapore Singapore |
660 | 0.5% |
| 29 |  Austria Austria |
624 | 0.5% |
| 30 |  United Arab Emirates United Arab Emirates |
622 | 0.5% |
| 31 |  Norway Norway |
599 | 0.5% |
| 32 |  Thailand Thailand |
580 | 0.5% |
| 33 |  Colombia Colombia |
540 | 0.4% |
| 34 |  Vietnam Vietnam |
527 | 0.4% |
| 35 |  Malaysia Malaysia |
516 | 0.4% |
| 36 |  Philippines Philippines |
512 | 0.4% |
| 37 |  Bangladesh Bangladesh |
511 | 0.4% |
| 38 |  Denmark Denmark |
504 | 0.4% |
| 39 |  Romania Romania |
481 | 0.4% |
| 40 |  South Africa South Africa |
480 | 0.4% |
| 41 |  Hong Kong Hong Kong |
450 | 0.4% |
| 42 |  Czech Republic Czech Republic |
433 | 0.3% |
| 43 |  Egypt Egypt |
430 | 0.3% |
| 44 |  Chile Chile |
408 | 0.3% |
| 45 |  Pakistan Pakistan |
408 | 0.3% |
| 46 |  Peru Peru |
381 | 0.3% |
| 47 |  Portugal Portugal |
381 | 0.3% |
| 48 |  Nigeria Nigeria |
377 | 0.3% |
| 49 |  Kazakhstan Kazakhstan |
360 | 0.3% |
| 50 |  Finland Finland |
338 | 0.3% |
| 51 |  Algeria Algeria |
317 | 0.3% |
| 52 |  Greece Greece |
308 | 0.2% |
| 53 |  Iran Iran |
300 | 0.2% |
| 54 |  New Zealand New Zealand |
279 | 0.2% |
| 55 |  Hungary Hungary |
271 | 0.2% |
| 56 |  Iraq Iraq |
265 | 0.2% |
| 57 |  Ukraine Ukraine |
225 | 0.2% |
| 58 |  Qatar Qatar |
217 | 0.2% |
| 59 |  Morocco Morocco |
194 | 0.2% |
| 60 |  Uzbekistan Uzbekistan |
182 | 0.1% |
| 61 |  Kuwait Kuwait |
173 | 0.1% |
| 62 |  Slovakia Slovakia |
169 | 0.1% |
| 63 |  Angola Angola |
152 | 0.1% |
| 64 |  Bulgaria Bulgaria |
148 | 0.1% |
| 65 |  Kenya Kenya |
147 | 0.1% |
| 66 |  Ecuador Ecuador |
138 | 0.1% |
| 67 |  Dominican Republic Dominican Republic |
136 | 0.1% |
| 68 |  Puerto Rico Puerto Rico |
129 | 0.1% |
| 69 |  Guatemala Guatemala |
129 | 0.1% |
| 70 |  Congo (DRC) Congo (DRC) |
123 | 0.1% |
| 71 |  Ethiopia Ethiopia |
122 | 0.1% |
| 72 |  Ghana Ghana |
118 | 0.1% |
| 73 |  Oman Oman |
117 | 0.1% |
| 74 |  Croatia Croatia |
117 | 0.1% |
| 75 |  Côte d’Ivoire Côte d’Ivoire |
112 | 0.1% |
| 76 |  Serbia Serbia |
112 | 0.1% |
| 77 |  Venezuela Venezuela |
111 | 0.1% |
| 78 |  Luxembourg Luxembourg |
110 | 0.1% |
| 79 |  Costa Rica Costa Rica |
110 | 0.1% |
| 80 |  Lithuania Lithuania |
106 | 0.1% |
| 81 |  Belarus Belarus |
102 | 0.1% |
| 82 |  Sri Lanka Sri Lanka |
99 | 0.1% |
| 83 |  Uruguay Uruguay |
96 | 0.1% |
| 84 |  Panama Panama |
95 | 0.1% |
| 85 |  Tanzania Tanzania |
95 | 0.1% |
| 86 |  Slovenia Slovenia |
87 | 0.1% |
| 87 |  Myanmar Myanmar |
84 | 0.1% |
| 88 |  Turkmenistan Turkmenistan |
83 | 0.1% |
| 89 |  Bolivia Bolivia |
81 | 0.1% |
| 90 |  Azerbaijan Azerbaijan |
78 | 0.1% |
| 91 |  Uganda Uganda |
73 | 0.1% |
| 92 |  Cameroon Cameroon |
65 | 0.1% |
| 93 |  Jordan Jordan |
65 | 0.1% |
| 94 |  Tunisia Tunisia |
61 | 0.0% |
| 95 |  Paraguay Paraguay |
61 | 0.0% |
| 96 |  Zimbabwe Zimbabwe |
57 | 0.0% |
| 97 |  Macao Macao |
54 | 0.0% |
| 98 |  Latvia Latvia |
54 | 0.0% |
| 99 |  Libya Libya |
52 | 0.0% |
| 100 |  Cambodia Cambodia |
52 | 0.0% |
| 101 |  Estonia Estonia |
52 | 0.0% |
| 102 |  Bahrain Bahrain |
49 | 0.0% |
| 103 |  Nepal Nepal |
46 | 0.0% |
| 104 |  Cyprus Cyprus |
45 | 0.0% |
| 105 |  Sudan Sudan |
45 | 0.0% |
| 106 |  Iceland Iceland |
44 | 0.0% |
| 107 |  Georgia Georgia |
43 | 0.0% |
| 108 |  Honduras Honduras |
42 | 0.0% |
| 109 |  Zambia Zambia |
41 | 0.0% |
| 110 |  Senegal Senegal |
40 | 0.0% |
| 111 |  El Salvador El Salvador |
40 | 0.0% |
| 112 |  Haiti Haiti |
39 | 0.0% |
| 113 |  Bosnia and Herzegovina Bosnia and Herzegovina |
37 | 0.0% |
| 114 |  Lebanon Lebanon |
34 | 0.0% |
| 115 |  Papua New Guinea Papua New Guinea |
34 | 0.0% |
| 116 |  Guyana Guyana |
34 | 0.0% |
| 117 |  Mali Mali |
34 | 0.0% |
| 118 |  Albania Albania |
33 | 0.0% |
| 119 |  Burkina Faso Burkina Faso |
33 | 0.0% |
| 120 |  Armenia Armenia |
32 | 0.0% |
| 121 |  Malta Malta |
31 | 0.0% |
| 122 |  Guinea Guinea |
30 | 0.0% |
| 123 |  Mongolia Mongolia |
28 | 0.0% |
| 124 |  Benin Benin |
28 | 0.0% |
| 125 |  Trinidad and Tobago Trinidad and Tobago |
27 | 0.0% |
| 126 |  Chad Chad |
26 | 0.0% |
| 127 |  Niger Niger |
25 | 0.0% |
| 128 |  Nicaragua Nicaragua |
24 | 0.0% |
| 129 |  Kyrgyz Republic Kyrgyz Republic |
24 | 0.0% |
| 130 |  Gabon Gabon |
23 | 0.0% |
| 131 |  Mozambique Mozambique |
23 | 0.0% |
| 132 |  Jamaica Jamaica |
23 | 0.0% |
| 133 |  Botswana Botswana |
22 | 0.0% |
| 134 |  Moldova Moldova |
22 | 0.0% |
| 135 |  North Macedonia North Macedonia |
22 | 0.0% |
| 136 |  Madagascar Madagascar |
21 | 0.0% |
| 137 |  Tajikistan Tajikistan |
20 | 0.0% |
| 138 |  Afghanistan Afghanistan |
20 | 0.0% |
| 139 |  Laos Laos |
19 | 0.0% |
| 140 |  Malawi Malawi |
18 | 0.0% |
| 141 |  Rwanda Rwanda |
17 | 0.0% |
| 142 |  Namibia Namibia |
17 | 0.0% |
| 143 |  Mauritius Mauritius |
17 | 0.0% |
| 144 |  Bahamas, The Bahamas, The |
17 | 0.0% |
| 145 |  Congo, Rep. of the Congo, Rep. of the |
17 | 0.0% |
| 146 |  Brunei Brunei |
17 | 0.0% |
| 147 |  West Bank and Gaza West Bank and Gaza |
16 | 0.0% |
| 148 |  Mauritania Mauritania |
14 | 0.0% |
| 149 |  Somalia Somalia |
14 | 0.0% |
| 150 |  Kosovo Kosovo |
14 | 0.0% |
| 151 |  Equatorial Guinea Equatorial Guinea |
14 | 0.0% |
| 152 |  Togo Togo |
13 | 0.0% |
| 153 |  Montenegro Montenegro |
10 | 0.0% |
| 154 |  Liechtenstein Liechtenstein |
9.4 | 0.0% |
| 155 |  Barbados Barbados |
8.5 | 0.0% |
| 156 |  Sierra Leone Sierra Leone |
8.3 | 0.0% |
| 157 |  Burundi Burundi |
8.1 | 0.0% |
| 158 |  Maldives Maldives |
8.1 | 0.0% |
| 159 |  Yemen Yemen |
7.4 | 0.0% |
| 160 |  Fiji Fiji |
6.4 | 0.0% |
| 161 |  South Sudan South Sudan |
6.1 | 0.0% |
| 162 |  Suriname Suriname |
5.9 | 0.0% |
| 163 |  Eswatini Eswatini |
5.8 | 0.0% |
| 164 |  Liberia Liberia |
5.6 | 0.0% |
| 165 |  Andorra Andorra |
4.9 | 0.0% |
| 166 |  Djibouti Djibouti |
4.7 | 0.0% |
| 167 |  Aruba Aruba |
4.7 | 0.0% |
| 168 |  Bhutan Bhutan |
3.9 | 0.0% |
| 169 |  Central African Republic Central African Republic |
3.5 | 0.0% |
| 170 |  Belize Belize |
3.5 | 0.0% |
| 171 |  Cabo Verde Cabo Verde |
3.4 | 0.0% |
| 172 |  Guinea-Bissau Guinea-Bissau |
3.0 | 0.0% |
| 173 |  Lesotho Lesotho |
3.0 | 0.0% |
| 174 |  Gambia, The Gambia, The |
2.8 | 0.0% |
| 175 |  Saint Lucia Saint Lucia |
2.8 | 0.0% |
| 176 |  San Marino San Marino |
2.4 | 0.0% |
| 177 |  Antigua and Barbuda Antigua and Barbuda |
2.4 | 0.0% |
| 178 |  Seychelles Seychelles |
2.3 | 0.0% |
| 179 |  Timor-Leste Timor-Leste |
2.2 | 0.0% |
| 180 |  Solomon Islands Solomon Islands |
1.8 | 0.0% |
| 181 |  Comoros Comoros |
1.8 | 0.0% |
| 182 |  Grenada Grenada |
1.5 | 0.0% |
| 183 |  Vanuatu Vanuatu |
1.4 | 0.0% |
| 184 |  Samoa Samoa |
1.4 | 0.0% |
| 185 |  Saint Vincent and the Grenadines Saint Vincent and the Grenadines |
1.2 | 0.0% |
| 186 |  São Tomé and Príncipe São Tomé and Príncipe |
1.2 | 0.0% |
| 187 |  Saint Kitts and Nevis Saint Kitts and Nevis |
1.1 | 0.0% |
| 188 |  Dominica Dominica |
0.8 | 0.0% |
| 189 |  Tonga Tonga |
0.7 | 0.0% |
| 190 |  Micronesia Micronesia |
0.5 | 0.0% |
| 191 |  Kiribati Kiribati |
0.4 | 0.0% |
| 192 |  Palau Palau |
0.4 | 0.0% |
| 193 |  Marshall Islands Marshall Islands |
0.3 | 0.0% |
| 194 |  Nauru Nauru |
0.2 | 0.0% |
| 195 |  Tuvalu Tuvalu |
0.1 | 0.0% |
| — |  World World |
126,254 | 100.0% |
Size does not necessarily translate into high growth. Among the world’s four largest economies, China leads with projected 4.4% real growth in 2026, while the U.S. is expected to grow a still respectable 2.3%. Germany and Japan, which have faced years of stagnation, are projected to grow by just 0.7–0.8%.
China’s outperformance continues a trend seen over the past few decades, although the country faces headwinds of its own, including a demographic slowdown and a prolonged property sector crisis.
The Shifting Balance of Power Towards Asia
Beyond China and Japan, Asia is increasingly driving global economic growth. Major emerging markets like India ($4.2 trillion) and Indonesia ($1.5 trillion) are expected to reshape the global economic order in the decades ahead.
India, which in recent years became the world’s most populous country, is now the sixth-largest economy globally. Its strong 6.6% growth forecast for 2026 could see it surpass the United Kingdom ($4.3 trillion) and even Japan by 2028.
Meanwhile, Indonesia’s projected 5% growth comes despite ongoing challenges in its manufacturing sector since the COVID-19 pandemic, as well as continued supply chain pressures linked to geopolitical tensions.
The Downstream Effects of Trade Tensions
Indonesia is not alone in feeling the effects of shifting global trade dynamics. High-tariff policies introduced by the U.S. since early 2025 have led to downward revisions in growth forecasts across several economies, particularly in North America.
Canada ($2.3 trillion) and Mexico ($2.1 trillion), both highly dependent on U.S. trade, are especially exposed. With U.S.-Canada relations strained and negotiations over a trilateral trade agreement progressing slowly, the North American economic bloc faces increasing uncertainty.
Learn More on the Voronoi App 
How will these numbers shift in 25 years? Find out with Visualizing the Future Global Economy by GDP in 2050 on Voronoi.Use This Visualization