
The Case for Active ETFs
Active ETFs are funds managed with the goal of beating the market—and they’re rapidly reshaping the asset management industry.
In partnership with New York Life Investments, this visual breaks down why these instruments present a compelling opportunity for investors in today’s climate.
The Explosive Growth of Active ETFs
Active ETFs are booming in popularity. Investor demand for professionally managed, transparent, and flexible investment solutions amid market volatility and higher taxes is fueling this growth.
The active ETF market is expected to grow from $1.2 trillion in 2025 to $10.9 trillion in 2035. This marks 800% growth in just a decade.
| Year | U.S. Active ETF AUM ($ trillions) |
|---|---|
| 2020 | 0.2 |
| 2021 | 0.3 |
| 2022 | 0.3 |
| 2023 | 0.5 |
| 2024 | 0.9 |
| 2025F | 1.2 |
| 2026F | 1.7 |
| 2027F | 2.2 |
| 2028F | 2.8 |
| 2029F | 3.5 |
| 2030F | 4.4 |
| 2031F | 5.3 |
| 2032F | 6.5 |
| 2033F | 7.8 |
| 2034F | 9.3 |
| 2035F | 10.9 |
But investors are always chasing one thing: alpha, or returns that beat the benchmark. How might these instruments stack up?
Alpha Potential
Behind every active ETF is a portfolio manager making strategic decisions to pursue stronger returns. This flexibility allows them to boost exposure in strong markets and dial it back during downturns—enhancing the potential to generate alpha.
Diverse Offerings
The investment world is moving toward personalization, and actively managed ETFs provide the flexibility to modernize portfolios. As the market grows, they offer ample room for innovation and differentiation—opening up new opportunities for investors.
| Demand (%) | ||||
|---|---|---|---|---|
| Region | Thematic ETF | Alternative ETF | Crypto ETF | |
| Asia-Pacific | 38 | 15 | 38 | |
| Canada | 21 | 16 | 5 | |
| Europe | 37 | 26 | 5 | |
| U.S. | 26 | 34 | 20 | |
Active ETF investors can choose from a wide range of offerings, including popular thematic ETFs focused on areas like green tech, innovation, and reshoring. Cryptocurrency and alternative ETFs are also on the rise.
Cost Efficiency
Fees for actively managed ETFs and mutual funds are at record lows, letting investors tap into active strategies without the high cost. In fact, issuers have cut management fees for active equity ETFs in half since 2015, enhancing return potential over time.
| Active ETF Management Expense Ratio | ||
|---|---|---|
| Year | Equity ETFs | Bond ETFs |
| 2015 | 0.82 | 0.47 |
| 2017 | 0.90 | 0.48 |
| 2019 | 0.74 | 0.40 |
| 2021 | 0.53 | 0.39 |
| 2023 | 0.43 | 0.35 |
The management expense ratio (MER) for equity ETFs was 0.82 in 2015 versus 0.43 by 2023. Similarly, the MER of bond ETFs has been cut from 0.47 to 0.35 over the same timeframe.
Taking Control
These instruments offer a powerful trifecta of opportunity—alpha potential, greater flexibility, and lower costs—making them a compelling choice for the modern investor.

Explore more insights from New York Life Investments
-

 Economy2 months ago
Charting U.S. Trade Relationships
Maintaining a balanced perspective on trade is crucial. Which countries does the U.S. have the largest trade deficits and surpluses with?
-

 Markets4 months ago
Trading Under Trump: Lessons from 2017-2021
With the second term of Trump underway, all eyes are on the markets to see how they react. Which sectors and regions that thrived last time?
-

 Markets6 months ago
2024 in Review: Stock, Bond, and Real Estate Performance
How did equities, fixed income, and real estate (and their underlying sectors) perform in the U.S. throughout 2024?
-
 Money9 months ago
Investing in an Era of an Aging Population
The U.S. population is aging. By 2070, the number of people over 65 will outnumber children. How can investors prepare?
-

 Politics11 months ago
Does it Matter to the Market Who Wins the White House?
After the president takes office, how have the market and the economy performed under Democrats vs Republicans?
-

 Markets12 months ago
Magnificent 7 Mania: Why Diversification Still Matters
The Magnificent Seven stocks all outperformed the S&P 500 in 2023. However, it’s crucial to remember that diversifying a portfolio at both the company level and…
-
 Markets1 year ago
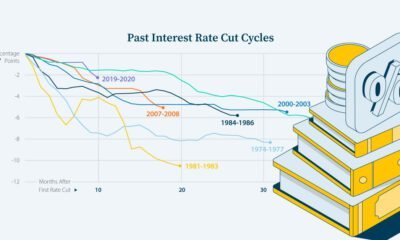
What History Reveals About Interest Rate Cuts
How have previous cycles of interest rate cuts in the U.S. impacted the economy and financial markets?
-
 Markets1 year ago
Beyond Big Names: The Case for Small- and Mid-Cap Stocks
Small- and mid-cap stocks have historically outperformed large caps. What are the opportunities and risks to consider?
-

 Markets1 year ago
Visualizing the Record $6 Trillion in Cash on the Sidelines
Assets in money market funds are at all-time highs. But as investors stockpile cash, are they missing out on today’s stock market rally?
-

 Markets2 years ago
What Drove Market Volatility in 2023?
Market volatility is often considered a gauge for investor fear. How did investors react as the economic climate evolved in 2023?
-

 Markets2 years ago
3 Reasons Why AI Enthusiasm Differs from the Dot-Com Bubble
Valuations are much lower than they were during the dot-com bubble, but what else sets the current AI enthusiasm apart?
-

 Investor Education2 years ago
Paying Less Tax: The Tax-Loss Harvesting Advantage
Learn how tax-loss harvesting works by using capital losses to offset capital gains, potentially reducing your tax bill.
-
 Markets2 years ago
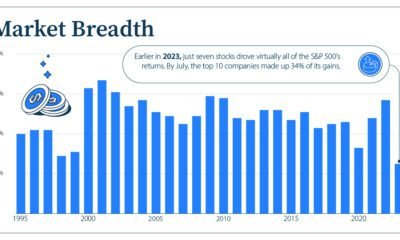
What’s Driving U.S. Stock Market Returns?
The performance of the S&P 500 has been strong so far in 2023. But what is fueling these stock market returns?
-

 Markets2 years ago
Decoding the Economics of a Soft Landing
Will the Federal Reserve achieve a soft landing? Here are key factors that play an important role in the direction of the U.S. economy.
-

 Markets2 years ago
3 Reasons to Explore International Stocks Now
International stocks are trading at 20-year lows relative to U.S. stocks, which could present attractive buying opportunities for investors.
-
 Markets2 years ago
Fact or Fiction? Test Your Knowledge About Investing During a Recession
From sector performance to market recoveries, test your knowledge about investing during a recession with this interactive quiz.
-

 Markets2 years ago
Reimagining the 60/40 Portfolio for Today’s Market
Amid uncertain economic times, a new allocation for the 60/40 portfolio may help investors target higher risk-adjusted returns.
-
 Markets2 years ago
The Recession Playbook: Three Strategies for Investors
How can investors prepare for a market downturn? What goes into a recession investment strategy? We look at three sectors to consider.
-

 Markets2 years ago
A Visual Guide to Bond Market Dynamics
What factors impact the bond market? Here’s how current interest rates, bond returns, and market volatility compare in a historical context.
-

 Investor Education2 years ago
5 Tax Tips for Investors
Learn five tax tips that may help maximize the after-tax value of your investments, including which assets may be best for certain accounts.
-

 Markets2 years ago
The Top Google Searches Related to Investing in 2022
What was on investors’ minds in 2022? Discover the top Google searches and how the dominant trends played out in portfolios.


var disqus_shortname = “visualcapitalist.disqus.com”;
var disqus_title = “The Case for Active ETFs”;
var disqus_url = “https://www.visualcapitalist.com/sp/the-case-for-active-etfs-nyl02/”;
var disqus_identifier = “visualcapitalist.disqus.com-179371”;