 See more visuals like this on the Voronoi app.
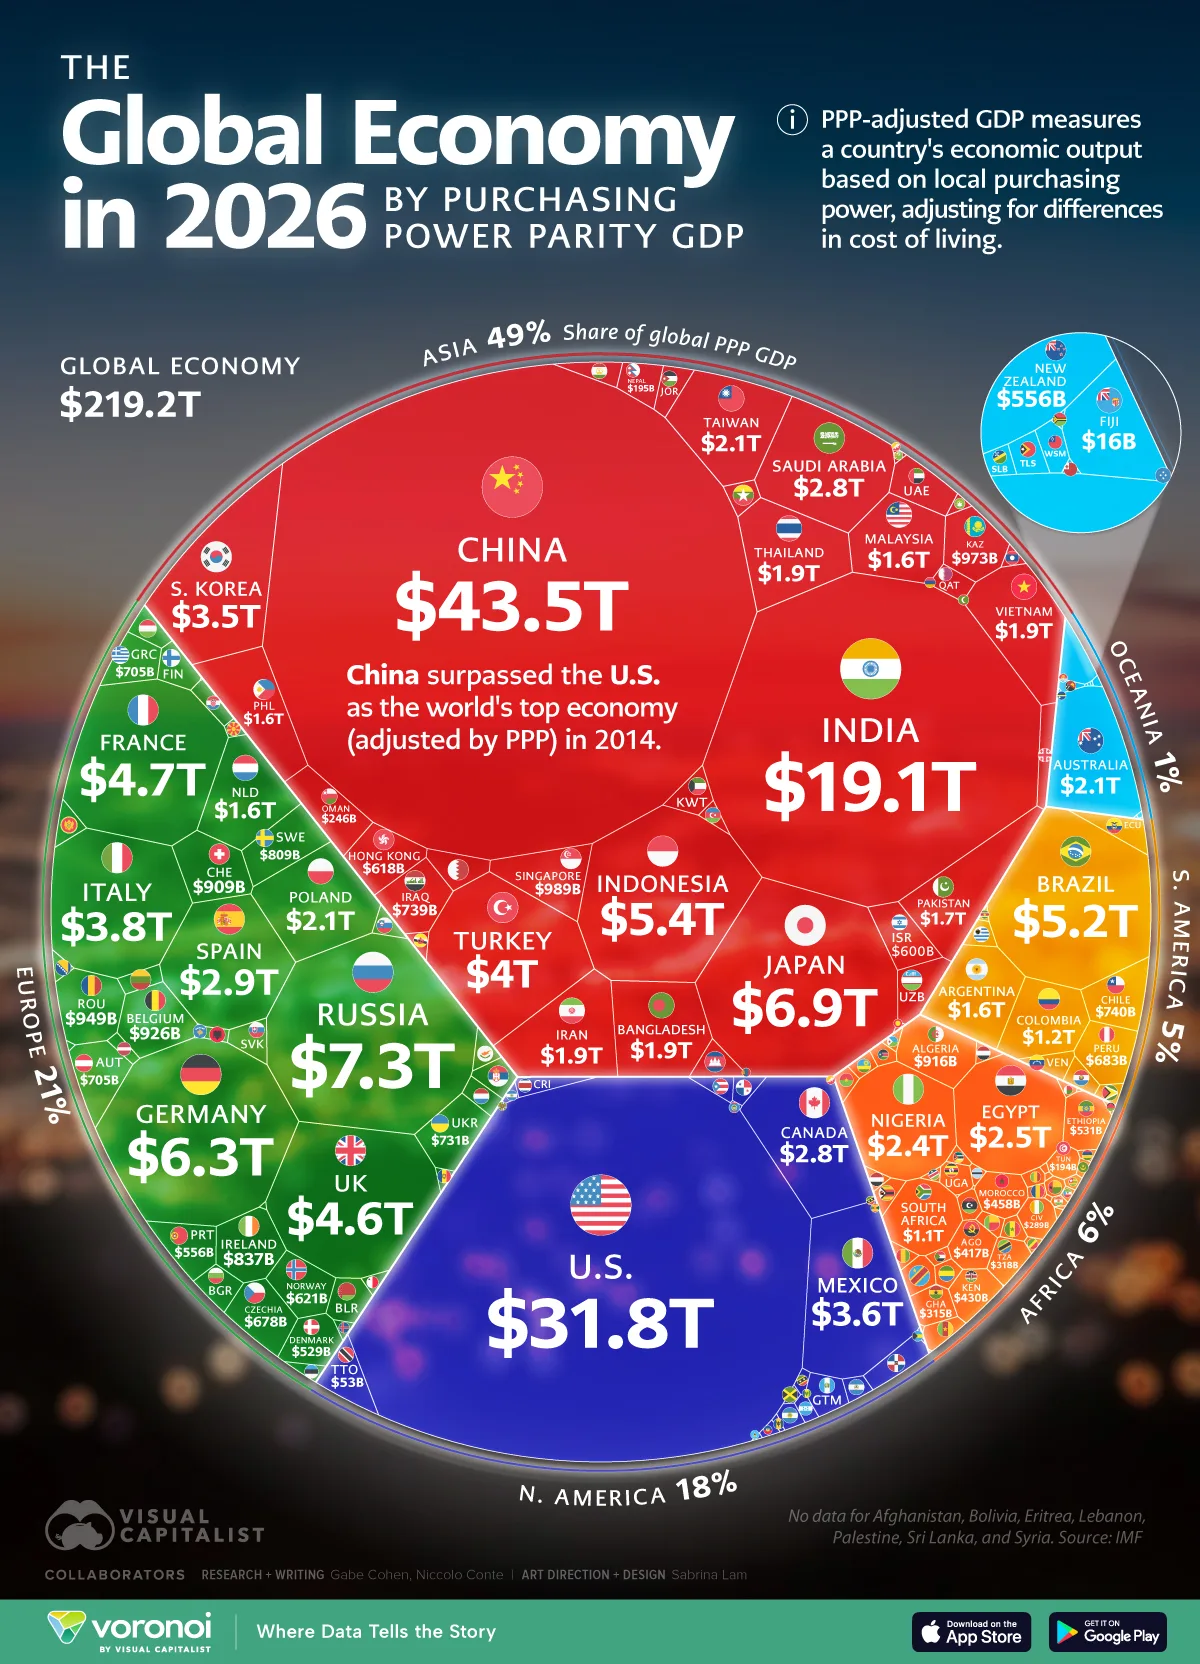
The Entire Global Economy in 2026 in One Chart (GDP, PPP)
See visuals like this from many other data creators on our Voronoi app. Download it for free on iOS or Android and discover incredible data-driven charts from a variety of trusted sources.
Key Takeaways
- Purchasing power parity (PPP) adjusts a country’s economic output to account for differences in cost of living.
- The global economy sits at over $219 trillion by this metric, of which nearly half is found in Asia.
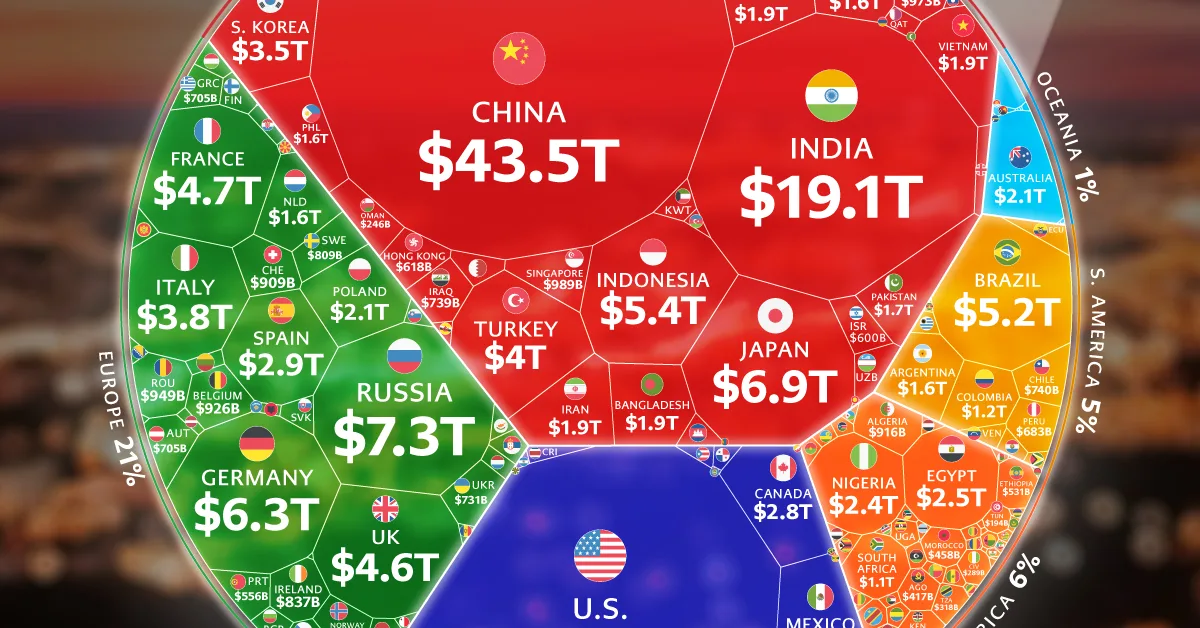
- At over $43.5 trillion, China has the world’s largest economy by GDP (PPP).
The global economy is worth roughly $219 trillion in 2026 when measured by purchasing power parity (PPP), which adjusts economic output for differences in cost of living.
This visualization shows the size of every country’s economy using PPP-adjusted GDP, making it easier to compare how national economies stack up around the world.
These projections for 2026 come from the International Monetary Fund.
How PPP Changes the Global Economic Rankings
When comparing economies using PPP, the global ranking looks very different from nominal GDP.
While the United States is the world’s largest economy by nominal GDP, when adjusting for PPP China has actually been the world’s dominant economy since 2014.
Today the Chinese economy is valued at $43.5 trillion, well ahead of the $31.8 trillion seen in the United States.
| Rank | Country | GDP (PPP, billions of international dollars) |
|---|---|---|
| 1 |  China China |
43,491.5 |
| 2 |  United States United States |
31,821.3 |
| 3 |  India India |
19,143.4 |
| 4 |  Russia Russia |
7,340.8 |
| 5 |  Japan Japan |
6,923.3 |
| 6 |  Germany Germany |
6,323.5 |
| 7 |  Indonesia Indonesia |
5,358.3 |
| 8 |  Brazil Brazil |
5,161.1 |
| 9 |  France France |
4,657.2 |
| 10 |  United Kingdom United Kingdom |
4,592.1 |
| 11 |  Turkey Turkey |
3,976.1 |
| 12 |  Italy Italy |
3,815.9 |
| 13 |  Mexico Mexico |
3,552.7 |
| 14 |  South Korea South Korea |
3,486.5 |
| 15 |  Spain Spain |
2,935.7 |
| 16 |  Saudi Arabia Saudi Arabia |
2,845.7 |
| 17 |  Canada Canada |
2,814.5 |
| 18 |  Egypt Egypt |
2,533.2 |
| 19 |  Nigeria Nigeria |
2,392.0 |
| 20 |  Poland Poland |
2,120.6 |
| 21 |  Taiwan Taiwan |
2,068.9 |
| 22 |  Australia Australia |
2,060.7 |
| 23 |  Vietnam Vietnam |
1,942.5 |
| 24 |  Iran Iran |
1,933.9 |
| 25 |  Thailand Thailand |
1,917.3 |
| 26 |  Bangladesh Bangladesh |
1,902.9 |
| 27 |  Pakistan Pakistan |
1,762.3 |
| 28 |  Philippines Philippines |
1,590.5 |
| 29 |  Argentina Argentina |
1,577.5 |
| 30 |  Malaysia Malaysia |
1,564.9 |
| 31 |  Netherlands Netherlands |
1,562.8 |
| 32 |  Colombia Colombia |
1,238.4 |
| 33 |  South Africa South Africa |
1,057.0 |
| 34 |  United Arab Emirates United Arab Emirates |
1,000.0 |
| 35 |  Singapore Singapore |
988.8 |
| 36 |  Kazakhstan Kazakhstan |
973.4 |
| 37 |  Romania Romania |
949.3 |
| 38 |  Belgium Belgium |
925.7 |
| 39 |  Algeria Algeria |
915.8 |
| 40 |  Switzerland Switzerland |
909.1 |
| 41 |  Ireland Ireland |
836.7 |
| 42 |  Sweden Sweden |
809.5 |
| 43 |  Chile Chile |
740.4 |
| 44 |  Iraq Iraq |
739.1 |
| 45 |  Ukraine Ukraine |
730.8 |
| 46 |  Austria Austria |
705.0 |
| 47 |  Peru Peru |
682.8 |
| 48 |  Czech Republic Czech Republic |
677.7 |
| 49 |  Norway Norway |
621.1 |
| 50 |  Hong Kong Hong Kong |
618.1 |
| 51 |  Israel Israel |
600.5 |
| 52 |  Portugal Portugal |
556.4 |
| 53 |  Ethiopia Ethiopia |
530.8 |
| 54 |  Denmark Denmark |
529.3 |
| 55 |  Uzbekistan Uzbekistan |
511.0 |
| 56 |  Greece Greece |
485.1 |
| 57 |  Hungary Hungary |
478.5 |
| 58 |  Morocco Morocco |
457.5 |
| 59 |  Kenya Kenya |
430.3 |
| 60 |  Angola Angola |
417.2 |
| 61 |  Qatar Qatar |
410.6 |
| 62 |  Finland Finland |
384.9 |
| 63 |  Dominican Republic Dominican Republic |
353.7 |
| 64 |  Belarus Belarus |
319.5 |
| 65 |  Tanzania Tanzania |
317.9 |
| 66 |  Ecuador Ecuador |
315.9 |
| 67 |  Ghana Ghana |
314.6 |
| 68 |  New Zealand New Zealand |
309.1 |
| 69 |  Guatemala Guatemala |
297.1 |
| 70 |  Côte d’Ivoire Côte d’Ivoire |
289.1 |
| 71 |  Myanmar Myanmar |
286.4 |
| 72 |  Kuwait Kuwait |
285.9 |
| 73 |  Azerbaijan Azerbaijan |
282.2 |
| 74 |  Bulgaria Bulgaria |
279.2 |
| 75 |  Slovak Republic Slovak Republic |
266.9 |
| 76 |  Oman Oman |
245.9 |
| 77 |  Venezuela Venezuela |
231.4 |
| 78 |  Serbia Serbia |
225.6 |
| 79 |  Dem. Rep. of the Congo Dem. Rep. of the Congo |
225.5 |
| 80 |  Panama Panama |
211.0 |
| 81 |  Croatia Croatia |
207.4 |
| 82 |  Uganda Uganda |
205.3 |
| 83 |  Nepal Nepal |
194.9 |
| 84 |  Tunisia Tunisia |
193.6 |
| 85 |  Cameroon Cameroon |
183.3 |
| 86 |  Costa Rica Costa Rica |
178.0 |
| 87 |  Lithuania Lithuania |
173.1 |
| 88 |  Puerto Rico Puerto Rico |
166.3 |
| 89 |  Cambodia Cambodia |
160.0 |
| 90 |  Turkmenistan Turkmenistan |
159.0 |
| 91 |  Paraguay Paraguay |
145.1 |
| 92 |  Zimbabwe Zimbabwe |
144.9 |
| 93 |  Jordan Jordan |
138.0 |
| 94 |  Sudan Sudan |
135.9 |
| 95 |  Uruguay Uruguay |
135.1 |
| 96 |  Libya Libya |
132.8 |
| 97 |  Slovenia Slovenia |
128.1 |
| 98 |  Georgia Georgia |
123.0 |
| 99 |  Bahrain Bahrain |
118.1 |
| 100 |  Luxembourg Luxembourg |
108.6 |
| 101 |  Senegal Senegal |
107.6 |
| 102 |  Zambia Zambia |
105.9 |
| 103 |  Macao Macao |
97.0 |
| 104 |  Guyana Guyana |
94.2 |
| 105 |  El Salvador El Salvador |
92.2 |
| 106 |  Honduras Honduras |
90.9 |
| 107 |  Latvia Latvia |
85.7 |
| 108 |  Guinea Guinea |
84.4 |
| 109 |  Laos Laos |
83.0 |
| 110 |  Bosnia and Herzegovina Bosnia and Herzegovina |
82.2 |
| 111 |  Armenia Armenia |
79.5 |
| 112 |  Mongolia Mongolia |
78.4 |
| 113 |  Mali Mali |
78.3 |
| 114 |  Burkina Faso Burkina Faso |
77.6 |
| 115 |  Benin Benin |
76.5 |
| 116 |  Yemen Yemen |
71.2 |
| 117 |  Estonia Estonia |
69.6 |
| 118 |  Kyrgyzstan Kyrgyzstan |
68.7 |
| 119 |  Madagascar Madagascar |
68.1 |
| 120 |  Tajikistan Tajikistan |
67.7 |
| 121 |  Nicaragua Nicaragua |
66.6 |
| 122 |  Niger Niger |
66.3 |
| 123 |  Albania Albania |
66.3 |
| 124 |  Mozambique Mozambique |
65.4 |
| 125 |  Cyprus Cyprus |
64.4 |
| 126 |  Rwanda Rwanda |
63.5 |
| 127 |  Chad Chad |
63.1 |
| 128 |  Gabon Gabon |
59.6 |
| 129 |  North Macedonia North Macedonia |
56.1 |
| 130 |  Botswana Botswana |
54.8 |
| 131 |  Trinidad and Tobago Trinidad and Tobago |
53.1 |
| 132 |  Papua New Guinea Papua New Guinea |
50.7 |
| 133 |  Moldova Moldova |
48.5 |
| 134 |  Malta Malta |
46.9 |
| 135 |  Brunei Darussalam Brunei Darussalam |
45.3 |
| 136 |  Republic of Congo Republic of Congo |
44.2 |
| 137 |  Malawi Malawi |
44.2 |
| 138 |  Mauritius Mauritius |
43.7 |
| 139 |  Mauritania Mauritania |
43.1 |
| 140 |  Namibia Namibia |
39.8 |
| 141 |  Jamaica Jamaica |
39.6 |
| 142 |  Haiti Haiti |
37.6 |
| 143 |  Togo Togo |
35.4 |
| 144 |  Sierra Leone Sierra Leone |
34.8 |
| 145 |  Equatorial Guinea Equatorial Guinea |
34.3 |
| 146 |  Kosovo Kosovo |
34.0 |
| 147 |  Somalia Somalia |
33.9 |
| 148 |  Iceland Iceland |
32.8 |
| 149 |  Montenegro Montenegro |
22.6 |
| 150 |  South Sudan South Sudan |
18.9 |
| 151 |  The Bahamas The Bahamas |
18.0 |
| 152 |  Eswatini Eswatini |
16.7 |
| 153 |  Fiji Fiji |
15.9 |
| 154 |  Maldives Maldives |
15.8 |
| 155 |  Suriname Suriname |
15.5 |
| 156 |  Bhutan Bhutan |
15.4 |
| 157 |  Burundi Burundi |
15.2 |
| 158 |  Liberia Liberia |
12.1 |
| 159 |  The Gambia The Gambia |
11.0 |
| 160 |  Djibouti Djibouti |
10.7 |
| 161 |  Liechtenstein Liechtenstein |
8.45 |
| 162 |  Central African Republic Central African Republic |
7.94 |
| 163 |  Lesotho Lesotho |
7.59 |
| 164 |  Timor-Leste Timor-Leste |
7.30 |
| 165 |  Guinea-Bissau Guinea-Bissau |
7.08 |
| 166 |  Barbados Barbados |
7.03 |
| 167 |  Cabo Verde Cabo Verde |
6.77 |
| 168 |  Andorra Andorra |
6.67 |
| 169 |  Belize Belize |
6.50 |
| 170 |  Aruba Aruba |
5.61 |
| 171 |  Saint Lucia Saint Lucia |
5.52 |
| 172 |  Seychelles Seychelles |
4.49 |
| 173 |  Comoros Comoros |
3.87 |
| 174 |  Antigua and Barbuda Antigua and Barbuda |
3.43 |
| 175 |  San Marino San Marino |
2.94 |
| 176 |  Grenada Grenada |
2.62 |
| 177 |  Saint Vincent and the Grenadines Saint Vincent and the Grenadines |
2.47 |
| 178 |  Solomon Islands Solomon Islands |
2.27 |
| 179 |  Samoa Samoa |
1.84 |
| 180 |  Saint Kitts and Nevis Saint Kitts and Nevis |
1.83 |
| 181 |  São Tomé and Príncipe São Tomé and Príncipe |
1.65 |
| 182 |  Dominica Dominica |
1.53 |
| 183 |  Vanuatu Vanuatu |
1.12 |
| 184 |  Tonga Tonga |
0.84 |
| 185 |  Kiribati Kiribati |
0.50 |
| 186 |  Micronesia, Fed. States of Micronesia, Fed. States of |
0.47 |
| 187 |  Palau Palau |
0.35 |
| 188 |  Marshall Islands Marshall Islands |
0.30 |
| 189 |  Nauru Nauru |
0.15 |
| 190 |  Tuvalu Tuvalu |
0.06 |
China is far from alone in representing Asia among the world’s largest economies, however. Asian countries today contribute 49% of the global economy, solidifying the continent’s place as the new center of international trade and production.
India is the third-largest PPP-adjusted economy worldwide, at $19.1 trillion, while Japan ($6.9 trillion), Indonesia ($5.4 trillion), and South Korea ($3.5 trillion) all see multi-trillion-dollar boosts compared to their nominal GDP owing to cheaper costs of living.
At 4.7 billion people, Asia is the most populous continent worldwide, and many of its smaller developing economies, such as Vietnam and Thailand (both $1.9 trillion), are expected to continue to grow rapidly in the coming years, indicating the continent’s continued dominance going forward.
The European Gap
If there’s one region where the difference between nominal and PPP-adjusted GDP is felt, it’s Europe. By nominal standards, Germany is the largest economy on this continent, followed by the United Kingdom, France, Italy, and Russia.
However, when adjusting for relative purchasing power Russia sees a massive boost, as a cheaper overall country, and soars to become Europe’s top economy at $7.3 trillion. By this metric, in fact, Russia is fourth worldwide behind only China, the U.S., and India.
France also surpasses the United Kingdom in this regard, but by and large the Eurozone economies fall behind Asian peers like Indonesia or Japan, which are able to acquire or produce goods at a more competitive rate.
The Boon of Emerging Markets
Outside of Eurasia, the story for emerging markets is much of the same. Brazil ($5.2 trillion) and Mexico ($3.6 trillion) each leapfrog Canada ($2.8 trillion) to become the second- and third-largest economies of the Americas, respectively.
Meanwhile, in Africa, home to a mere six percent of global GDP share, the three emerging-market economies of Egypt, Nigeria, and South Africa are responsible for roughly $6 trillion in total PPP-adjusted economic output.
Learn More on the Voronoi App
If you enjoyed today’s post, check out The Global Cost of Living Index 2026 on Voronoi, the new app from Visual Capitalist.