Mapped: The U.S. States Leading in Organ Donations
See visuals like this from many other data creators on our Voronoi app. Download it for free on iOS or Android and discover incredible data-driven charts from a variety of trusted sources.
Key Takeaways
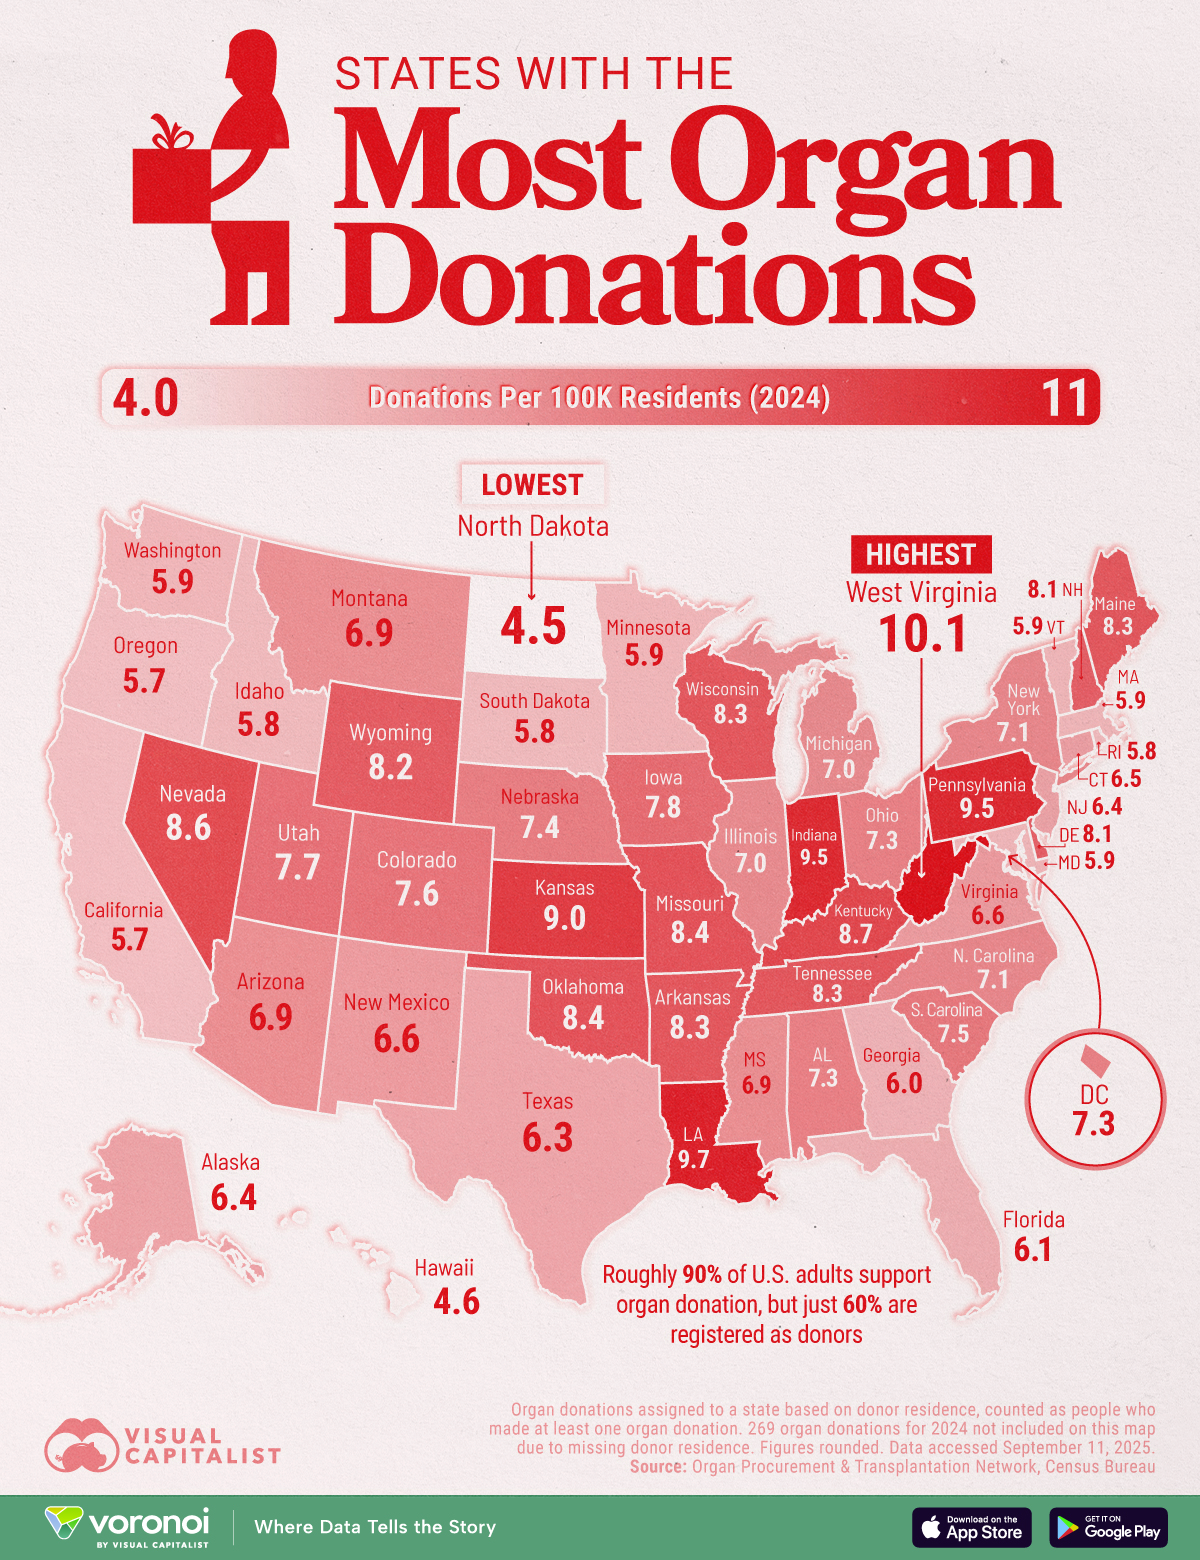
- West Virginia, Louisiana, and Pennsylvania each recorded about 10 organ donations per 100,000 residents in 2024, topping the nation.
- Across all states, deceased donors made up roughly 60–70% of total donations, underscoring the role of post-mortem consent.
- 13 Americans die every day, waiting for a transplant.
Every day, dozens of Americans receive life-saving transplants, but where do those donated organs come from?
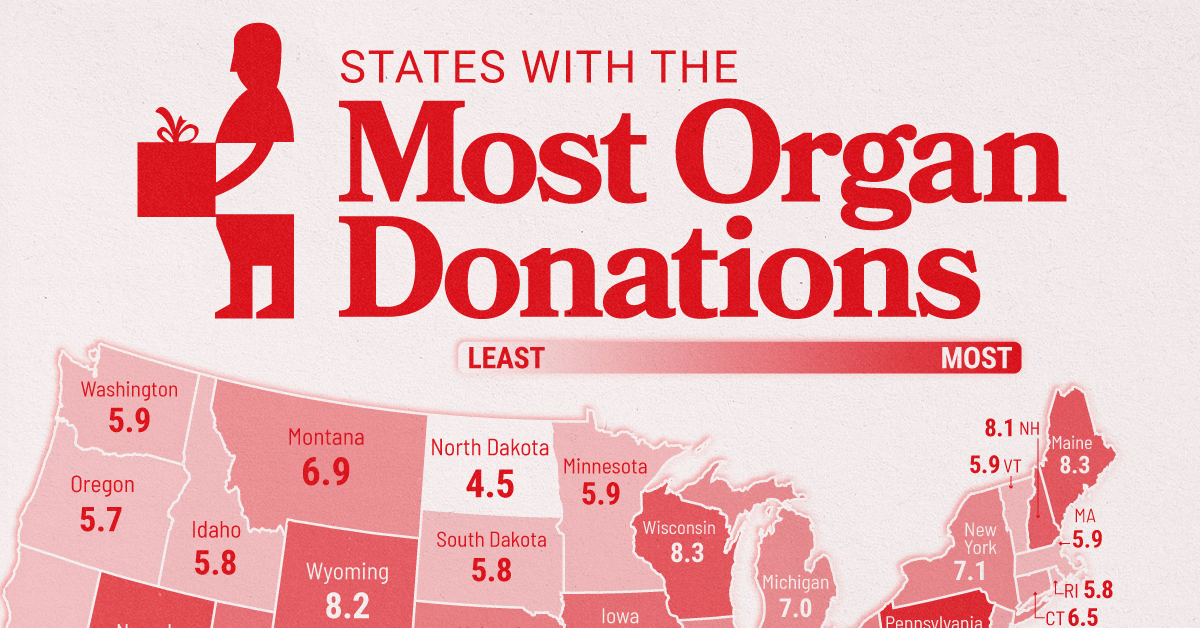
This visualization highlights how rates of organ donations vary widely across the U.S. and which states are leading the charge.
Data for is sourced from Organ Procurement & Transplantation Network and the U.S. Census Bureau.
 Organ donations assigned to a state based on donor residence, counted as people who made at least one organ donation. Rate calculations are rounded.
Organ Donations by U.S. State, Ranked
West Virginia ranks first with 10.1 donations per 100,000 people, despite ranking 36th in overall donations.
| Rank | State | State Code | Organ Donations Per 100K Residents (2024) |
All Organ Donations (2024) |
Population (2024) |
|---|---|---|---|---|---|
| 1 | West Virginia | WV | 10.1 | 179 | 1,769,979 |
| 2 | Louisiana | LA | 9.7 | 444 | 4,597,740 |
| 3 | Pennsylvania | PA | 9.5 | 1,245 | 13,078,751 |
| 4 | Indiana | IN | 9.5 | 657 | 6,924,275 |
| 5 | Kansas | KS | 9.0 | 266 | 2,970,606 |
| 6 | Kentucky | KY | 8.7 | 398 | 4,588,372 |
| 7 | Nevada | NV | 8.6 | 280 | 3,267,467 |
| 8 | Missouri | MO | 8.4 | 524 | 6,245,466 |
| 9 | Oklahoma | OK | 8.4 | 342 | 4,095,393 |
| 10 | Wisconsin | WI | 8.3 | 497 | 5,960,975 |
| 11 | Tennessee | TN | 8.3 | 602 | 7,227,750 |
| 12 | Arkansas | AR | 8.3 | 257 | 3,088,354 |
| 13 | Maine | ME | 8.3 | 116 | 1,405,012 |
| 14 | Wyoming | WY | 8.2 | 48 | 587,618 |
| 15 | New Hampshire | NH | 8.1 | 114 | 1,409,032 |
| 16 | Delaware | DE | 8.1 | 85 | 1,051,917 |
| 17 | Iowa | IA | 7.8 | 253 | 3,241,488 |
| 18 | Utah | UT | 7.7 | 271 | 3,503,613 |
| 19 | Colorado | CO | 7.6 | 451 | 5,957,493 |
| 20 | South Carolina | SC | 7.5 | 410 | 5,478,831 |
| 21 | Nebraska | NE | 7.4 | 149 | 2,005,465 |
| 22 | Ohio | OH | 7.3 | 872 | 11,883,304 |
| 23 | Alabama | AL | 7.3 | 377 | 5,157,699 |
| 24 | District of Columbia | DC | 7.3 | 51 | 702,250 |
| 25 | North Carolina | NC | 7.1 | 783 | 11,046,024 |
| 26 | New York | NY | 7.1 | 1,401 | 19,867,248 |
| 27 | Illinois | IL | 7.0 | 892 | 12,710,158 |
| 28 | Michigan | MI | 7.0 | 710 | 10,140,459 |
| 29 | Montana | MT | 6.9 | 79 | 1,137,233 |
| 30 | Arizona | AZ | 6.9 | 524 | 7,582,384 |
| 31 | Mississippi | MS | 6.9 | 203 | 2,943,045 |
| 32 | New Mexico | NM | 6.6 | 141 | 2,130,256 |
| 33 | Virginia | VA | 6.6 | 581 | 8,811,195 |
| 34 | Connecticut | CT | 6.5 | 238 | 3,675,069 |
| 35 | New Jersey | NJ | 6.4 | 610 | 9,500,851 |
| 36 | Alaska | AK | 6.4 | 47 | 740,133 |
| 37 | Texas | TX | 6.3 | 1,980 | 31,290,831 |
| 38 | Florida | FL | 6.1 | 1,416 | 23,372,215 |
| 39 | Georgia | GA | 6.0 | 672 | 11,180,878 |
| 40 | Minnesota | MN | 5.9 | 344 | 5,793,151 |
| 41 | Massachusetts | MA | 5.9 | 423 | 7,136,171 |
| 42 | Washington | WA | 5.9 | 469 | 7,958,180 |
| 43 | Vermont | VT | 5.9 | 38 | 648,493 |
| 44 | Maryland | MD | 5.9 | 367 | 6,263,220 |
| 45 | Rhode Island | RI | 5.8 | 65 | 1,112,308 |
| 46 | South Dakota | SD | 5.8 | 54 | 924,669 |
| 47 | Idaho | ID | 5.8 | 116 | 2,001,619 |
| 48 | Oregon | OR | 5.7 | 244 | 4,272,371 |
| 49 | California | CA | 5.7 | 2,229 | 39,431,263 |
| 50 | Hawaii | HI | 4.6 | 67 | 1,446,146 |
| 51 | North Dakota | ND | 4.5 | 36 | 796,568 |
| N/A | Unassigned Residence | N/A | 269 | N/A |
Louisiana, Pennsylvania, and Indiana follow closely, both also at nearly 10 donations per 100,000 residents.
269 organ donations for 2024 not assigned to a state due to missing donor residence.Donor Registration Rates
To add to the discussion, we can cross referencing this data with registration rates.
| Rank | State | State Code | Organ Donations Per 100K Residents |
Organ Donor Registration Rate 2023 (%) |
|---|---|---|---|---|
| 1 | West Virginia | WV | 10.1 | N/A |
| 2 | Louisiana | LA | 9.7 | 47.6 |
| 3 | Pennsylvania | PA | 9.5 | 47.0 |
| 4 | Indiana | IN | 9.5 | 67.6 |
| 5 | Kansas | KS | 9.0 | N/A |
| 6 | Kentucky | KY | 8.7 | N/A |
| 7 | Nevada | NV | 8.6 | N/A |
| 8 | Missouri | MO | 8.4 | N/A |
| 9 | Oklahoma | OK | 8.4 | 49.3 |
| 10 | Wisconsin | WI | 8.3 | 52.8 |
| 11 | Tennessee | TN | 8.3 | 43.7 |
| 12 | Arkansas | AR | 8.3 | N/A |
| 13 | Maine | ME | 8.3 | 56.0 |
| 14 | Wyoming | WY | 8.2 | 58.4 |
| 15 | New Hampshire | NH | 8.1 | 54.8 |
| 16 | Delaware | DE | 8.1 | N/A |
| 17 | Iowa | IA | 7.8 | 59.7 |
| 18 | Utah | UT | 7.7 | 58.5 |
| 19 | Colorado | CO | 7.6 | 66.2 |
| 20 | South Carolina | SC | 7.5 | 45.6 |
| 21 | Nebraska | NE | 7.4 | N/A |
| 22 | Ohio | OH | 7.3 | 58.0 |
| 23 | Alabama | AL | 7.3 | N/A |
| 24 | District of Columbia | DC | 7.3 | 51.6 |
| 25 | North Carolina | NC | 7.1 | 56.3 |
| 26 | New York | NY | 7.1 | N/A |
| 27 | Illinois | IL | 7.0 | N/A |
| 28 | Michigan | MI | 7.0 | N/A |
| 29 | Montana | MT | 6.9 | 59.5 |
| 30 | Arizona | AZ | 6.9 | N/A |
| 31 | Mississippi | MS | 6.9 | 36.4 |
| 32 | New Mexico | NM | 6.6 | N/A |
| 33 | Virginia | VA | 6.6 | N/A |
| 34 | Connecticut | CT | 6.5 | 45.9 |
| 35 | New Jersey | NJ | 6.4 | 52.4 |
| 36 | Alaska | AK | 6.4 | N/A |
| 37 | Texas | TX | 6.3 | N/A |
| 38 | Florida | FL | 6.1 | 39.4 |
| 39 | Georgia | GA | 6.0 | 32.8 |
| 40 | Minnesota | MN | 5.9 | 54.8 |
| 41 | Massachusetts | MA | 5.9 | 47.7 |
| 42 | Washington | WA | 5.9 | 55.2 |
| 43 | Vermont | VT | 5.9 | 56.0 |
| 44 | Maryland | MD | 5.9 | 38.1 |
| 45 | Rhode Island | RI | 5.8 | 45.4 |
| 46 | South Dakota | SD | 5.8 | 60.1 |
| 47 | Idaho | ID | 5.8 | 55.5 |
| 48 | Oregon | OR | 5.7 | 55.9 |
| 49 | California | CA | 5.7 | 31.3 |
| 50 | Hawaii | HI | 4.6 | N/A |
| 51 | North Dakota | ND | 4.5 | 54.0 |
Donor registration rates measure the percentage of eligible population that said yes when presented with registration opportunity at their state DMV in a given year. As a result, figures are missing for multiple states due to lack of corroborating DMV data. Source: Donate Life America, via Newsweek.Generally speaking, the establishment of state organ donor registries is associated with a higher supply of deceased donors.
However, the 2023–2024 data specifically doesn’t have much to say linking the two.
This suggests that multiple factors influence organ donation outcomes beyond just having willing donors.
Here are all the factors not accounted for in both datasets.
- Medical demand variations: States may have different rates of organ failure and transplant needs based on population health profiles.
- Population demographics: Age structures, comorbidity rates, and eligibility factors that affect both donor suitability and transplant candidacy.
- Medical complexity: Varying rates of conditions that make donors medically unsuitable despite registration willingness.
- Family consent patterns: Cultural, religious, or regional attitudes toward donation that influence family decision-making regardless of individual registration.
- Hospital infrastructure quality: Variation in medical centers’ capacity to identify potential donors, maintain organ viability, and coordinate procurement.
- Healthcare system efficiency: Differences in protocols for brain death declaration, family counseling, and donor management.
- Geographic logistics: Distance to transplant centers, transportation infrastructure, and organ preservation capabilities affecting successful procurement.
- State policy frameworks: Legal requirements, hospital mandates, and organ procurement organization structures that vary by jurisdiction.
- Economic factors: Insurance coverage patterns, healthcare access, and socioeconomic factors affecting both donor identification and recipient eligibility.
Deceased Organ Donors Are Critical to Transplants
Across the board, about 60-70% of donations in 2024 came from deceased donors.
| State | State Code | All Organ Donations (2024) | Deceased Donor (2024) | Living Donor (2024) |
|---|---|---|---|---|
| Alabama | AL | 377 | 304 | 73 |
| Alaska | AK | 47 | 39 | 8 |
| Arizona | AZ | 524 | 380 | 144 |
| Arkansas | AR | 257 | 219 | 38 |
| California | CA | 2,229 | 1,530 | 699 |
| Colorado | CO | 451 | 275 | 176 |
| Connecticut | CT | 238 | 164 | 74 |
| Delaware | DE | 85 | 66 | 19 |
| District of Columbia | DC | 51 | 25 | 26 |
| Florida | FL | 1,416 | 1,049 | 367 |
| Georgia | GA | 672 | 462 | 210 |
| Hawaii | HI | 67 | 54 | 13 |
| Idaho | ID | 116 | 81 | 35 |
| Illinois | IL | 892 | 601 | 291 |
| Indiana | IN | 657 | 539 | 118 |
| Iowa | IA | 253 | 181 | 72 |
| Kansas | KS | 266 | 217 | 49 |
| Kentucky | KY | 398 | 305 | 93 |
| Louisiana | LA | 444 | 358 | 86 |
| Maine | ME | 116 | 79 | 37 |
| Maryland | MD | 367 | 239 | 128 |
| Massachusetts | MA | 423 | 279 | 144 |
| Michigan | MI | 710 | 566 | 144 |
| Minnesota | MN | 344 | 215 | 129 |
| Mississippi | MS | 203 | 163 | 40 |
| Missouri | MO | 524 | 413 | 111 |
| Montana | MT | 79 | 58 | 21 |
| Nebraska | NE | 149 | 102 | 47 |
| Nevada | NV | 280 | 241 | 39 |
| New Hampshire | NH | 114 | 76 | 38 |
| New Jersey | NJ | 610 | 374 | 236 |
| New Mexico | NM | 141 | 112 | 29 |
| New York | NY | 1,401 | 907 | 494 |
| North Carolina | NC | 783 | 580 | 203 |
| North Dakota | ND | 36 | 22 | 14 |
| Ohio | OH | 872 | 656 | 216 |
| Oklahoma | OK | 342 | 293 | 49 |
| Oregon | OR | 244 | 195 | 49 |
| Pennsylvania | PA | 1,245 | 857 | 388 |
| Rhode Island | RI | 65 | 41 | 24 |
| South Carolina | SC | 410 | 309 | 101 |
| South Dakota | SD | 54 | 26 | 28 |
| Tennessee | TN | 602 | 498 | 104 |
| Texas | TX | 1,980 | 1,212 | 768 |
| Utah | UT | 271 | 167 | 104 |
| Vermont | VT | 38 | 19 | 19 |
| Virginia | VA | 581 | 374 | 207 |
| Washington | WA | 469 | 361 | 108 |
| West Virginia | WV | 179 | 151 | 28 |
| Wisconsin | WI | 497 | 317 | 180 |
| Wyoming | WY | 48 | 33 | 15 |
| Unassigned Residence | N/A | 269 | 84 | 185 |
Advances in preservation technology have extended the viable window for organs retrieved post-mortem, making it easier to match them with recipients in distant states.
Meanwhile, living donations—kidneys or partial livers—remain steady but limited by stricter medical criteria and donor risk.
Policymakers argue that mandated consent or “opt-out” systems could elevate overall availability, but such measures remain politically contentious in many jurisdictions.
For reference, 13 Americans die every day, waiting for a transplant .
Learn More on the Voronoi App 
If you enjoyed today’s post, check out Mapped: Where Americans Pay the Most (and Least) for Health Insurance on Voronoi, the new app from Visual Capitalist.