Visualized: Future Electricity Usage by Country (2024–2035)
As global electrification ramps up, electricity demand in major economies is expected to rise, driving a corresponding increase in demand for copper, the metal that powers the modern energy grid.
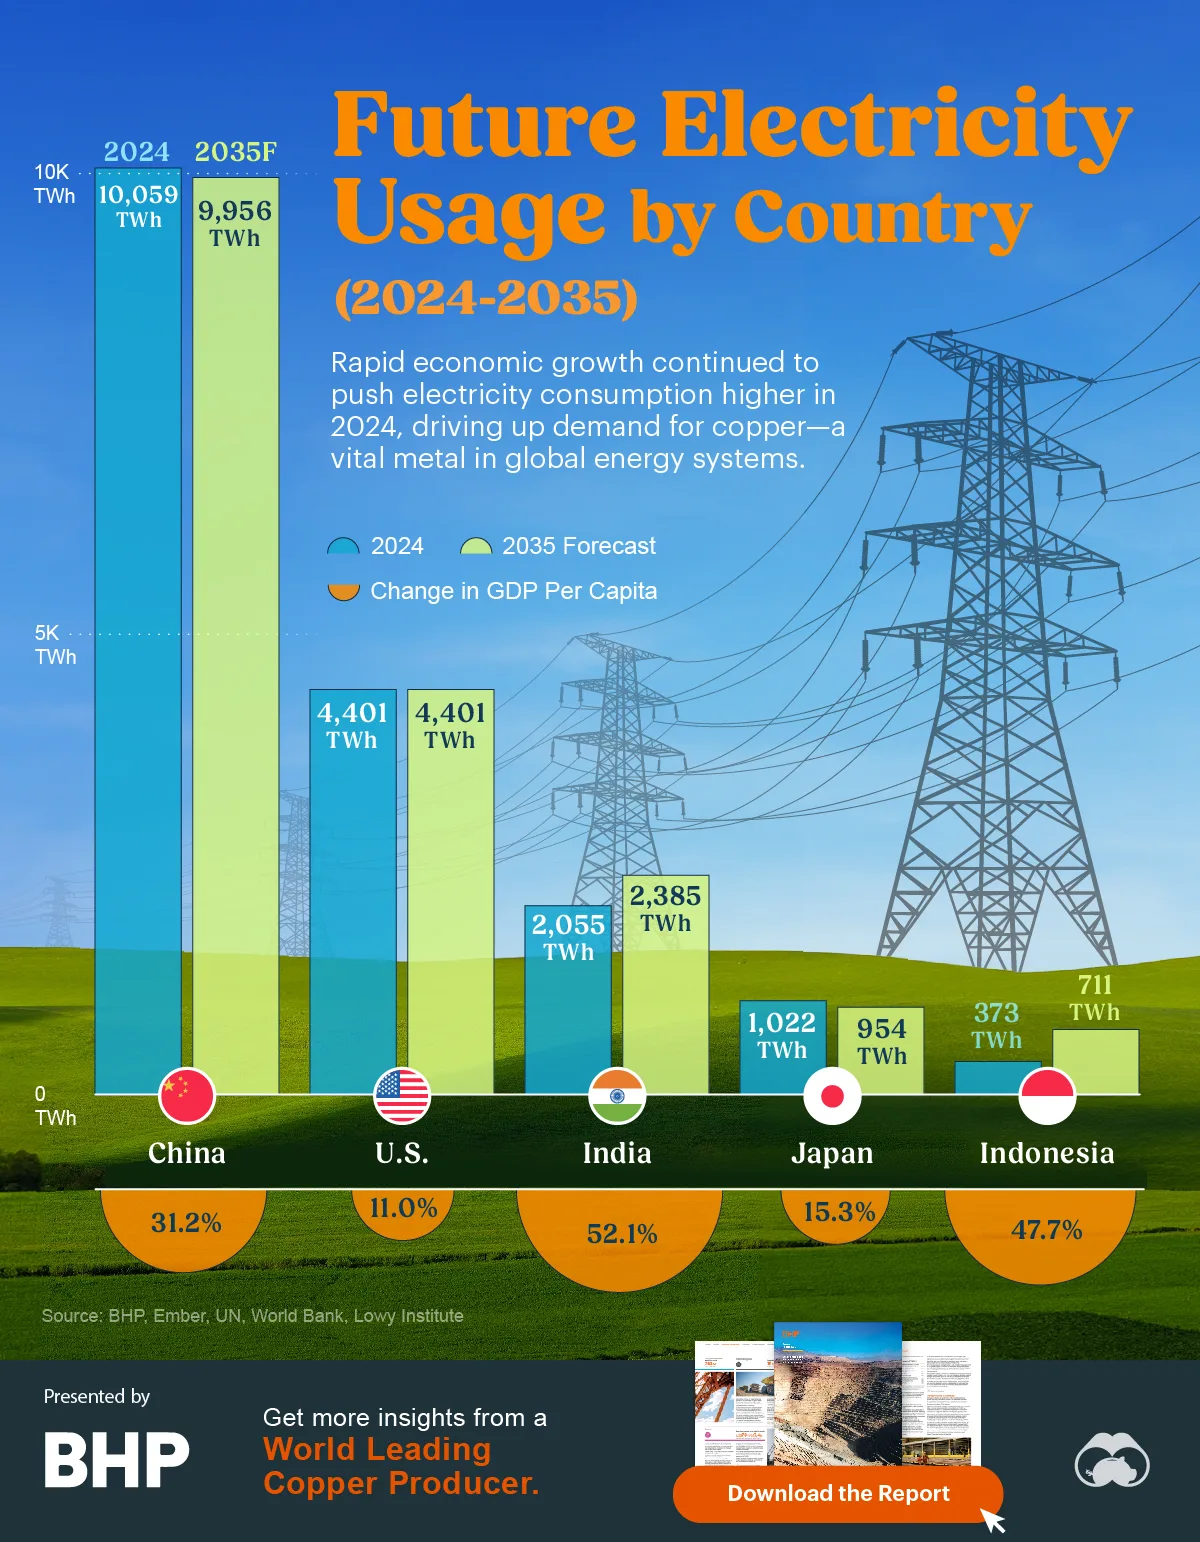
This graphic, sponsored by BHP, utilizes data from Ember, the World Bank, and the Lowy Institute to visualize the projected growth in electricity consumption and GDP per capita across five major economies between 2024 and 2035.
Electricity Usage Growth and Decline
Estimates of each country’s electricity consumption in 2024 were released in 2025, whereas projections for 2035 consumption were formed back in 2021.
Together, these five economies are projected to increase their electricity consumption by 500 terawatt hours (TWh) by 2035.
| Country | 2024 TWh | 2035 TWh | Projected Change in GDP Per Capita |
|---|---|---|---|
 China China |
10,059 | 9,956 | 31.2% |
 U.S. U.S. |
4,401 | 4,401 | 11.0% |
 India India |
2,055 | 2,385 | 52.1% |
 Japan Japan |
1,022 | 954 | 15.3% |
 Indonesia Indonesia |
373 | 711 | 47.7% |
- China, already the world’s largest electricity consumer, is expected to decline/stagnate from 10,059 TWh to 9,956 TWh.
- The U.S. will see demand remain around 4,401 TWh— enough to charge more than 2 billion Tesla Model 3s.
- India’s consumption will jump from 2,055 TWh to 2,385 TWh, narrowing the gap with advanced economies.
- Japan will decline in electricity consumption from 1,022 TWh to 954 TWh.
- Indonesia’s electricity use will double, climbing from 373 TWh to 711 TWh.
Growth in GDP per capita is one of the most significant contributors to the projected increase in electricity consumption. As economies grow, inhabitants gain the ability to purchase technologies that consume more electricity.
Where Copper Comes In
Copper’s exceptional conductivity makes it indispensable across the power system, from high-voltage transmission lines to home wiring and electric vehicles. It’s the backbone of moving electricity.
As countries expand their grids and scale clean energy, copper demand is set to rise sharply.
Renewables such as wind and solar can use up to 5x more copper than conventional generation, and electric vehicles use up to 4x more than internal-combustion models.

Get more insights from a World Leading Copper Producer Subscribe Here
-

 Commodities5 months ago
Charted: Future Electricity Usage by Country
Projected electricity usage growth in major economies is driving global copper demand—see how energy use is rising from 2023 to 2035.
-

 Agriculture5 months ago
Visualized: The Surge in Global Potash Demand
Global potash demand is projected to rise 65% by 2050. See what’s driving the surge and why potash is key to global food security.
-

 Agriculture9 months ago
Population Growth, Crop Production, and Fertilizer Use Since 1960
Since 1960, potash demand has outpaced both population growth and crop production.
-

 Mining12 months ago
Charted: Major Copper Discoveries Since 1900
Copper discoveries are becoming increasingly rare and often found deeper underground.
-

 Mining1 year ago
Chart: Global Copper Demand (2021-2050P)
Copper demand globally is estimated to rise by 70% from 2021 to 2050. What are the main sources of this increase in demand?
-

 Mining1 year ago
China’s Steel Demand Through Time
China’s steel demand remains robust, but the breakdown on a sectoral level has shifted since 2010. Which sectors are driving steel consumption?
- Source: https://www.visualcapitalist.com/sp/visualized-future-electricity-usage-by-country-2024-2035/


var disqus_shortname = “visualcapitalist.disqus.com”;
var disqus_title = “Visualized: Future Electricity Usage by Country (2024–2035)”;
var disqus_url = “https://www.visualcapitalist.com/sp/visualized-future-electricity-usage-by-country-2024-2035/”;
var disqus_identifier = “visualcapitalist.disqus.com-184432”;