Visualized: The Most Common Master’s Degrees in 43 Countries
See visuals like this from many other data creators on our Voronoi app. Download it for free on iOS or Android and discover incredible data-driven charts from a variety of trusted sources.
Key Takeaways
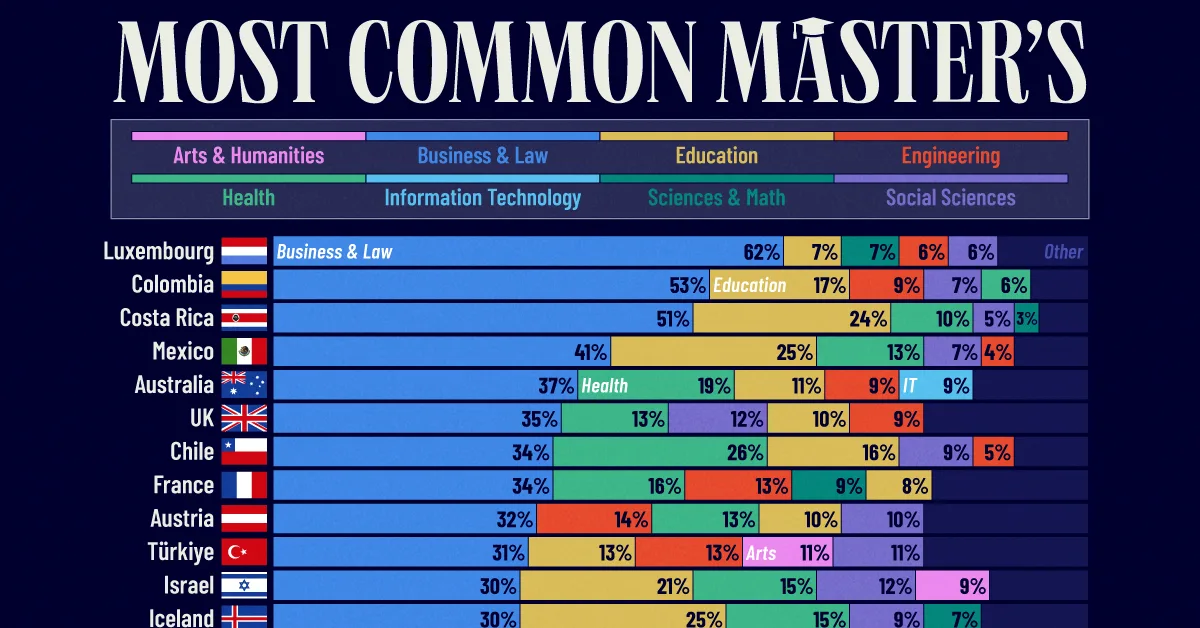
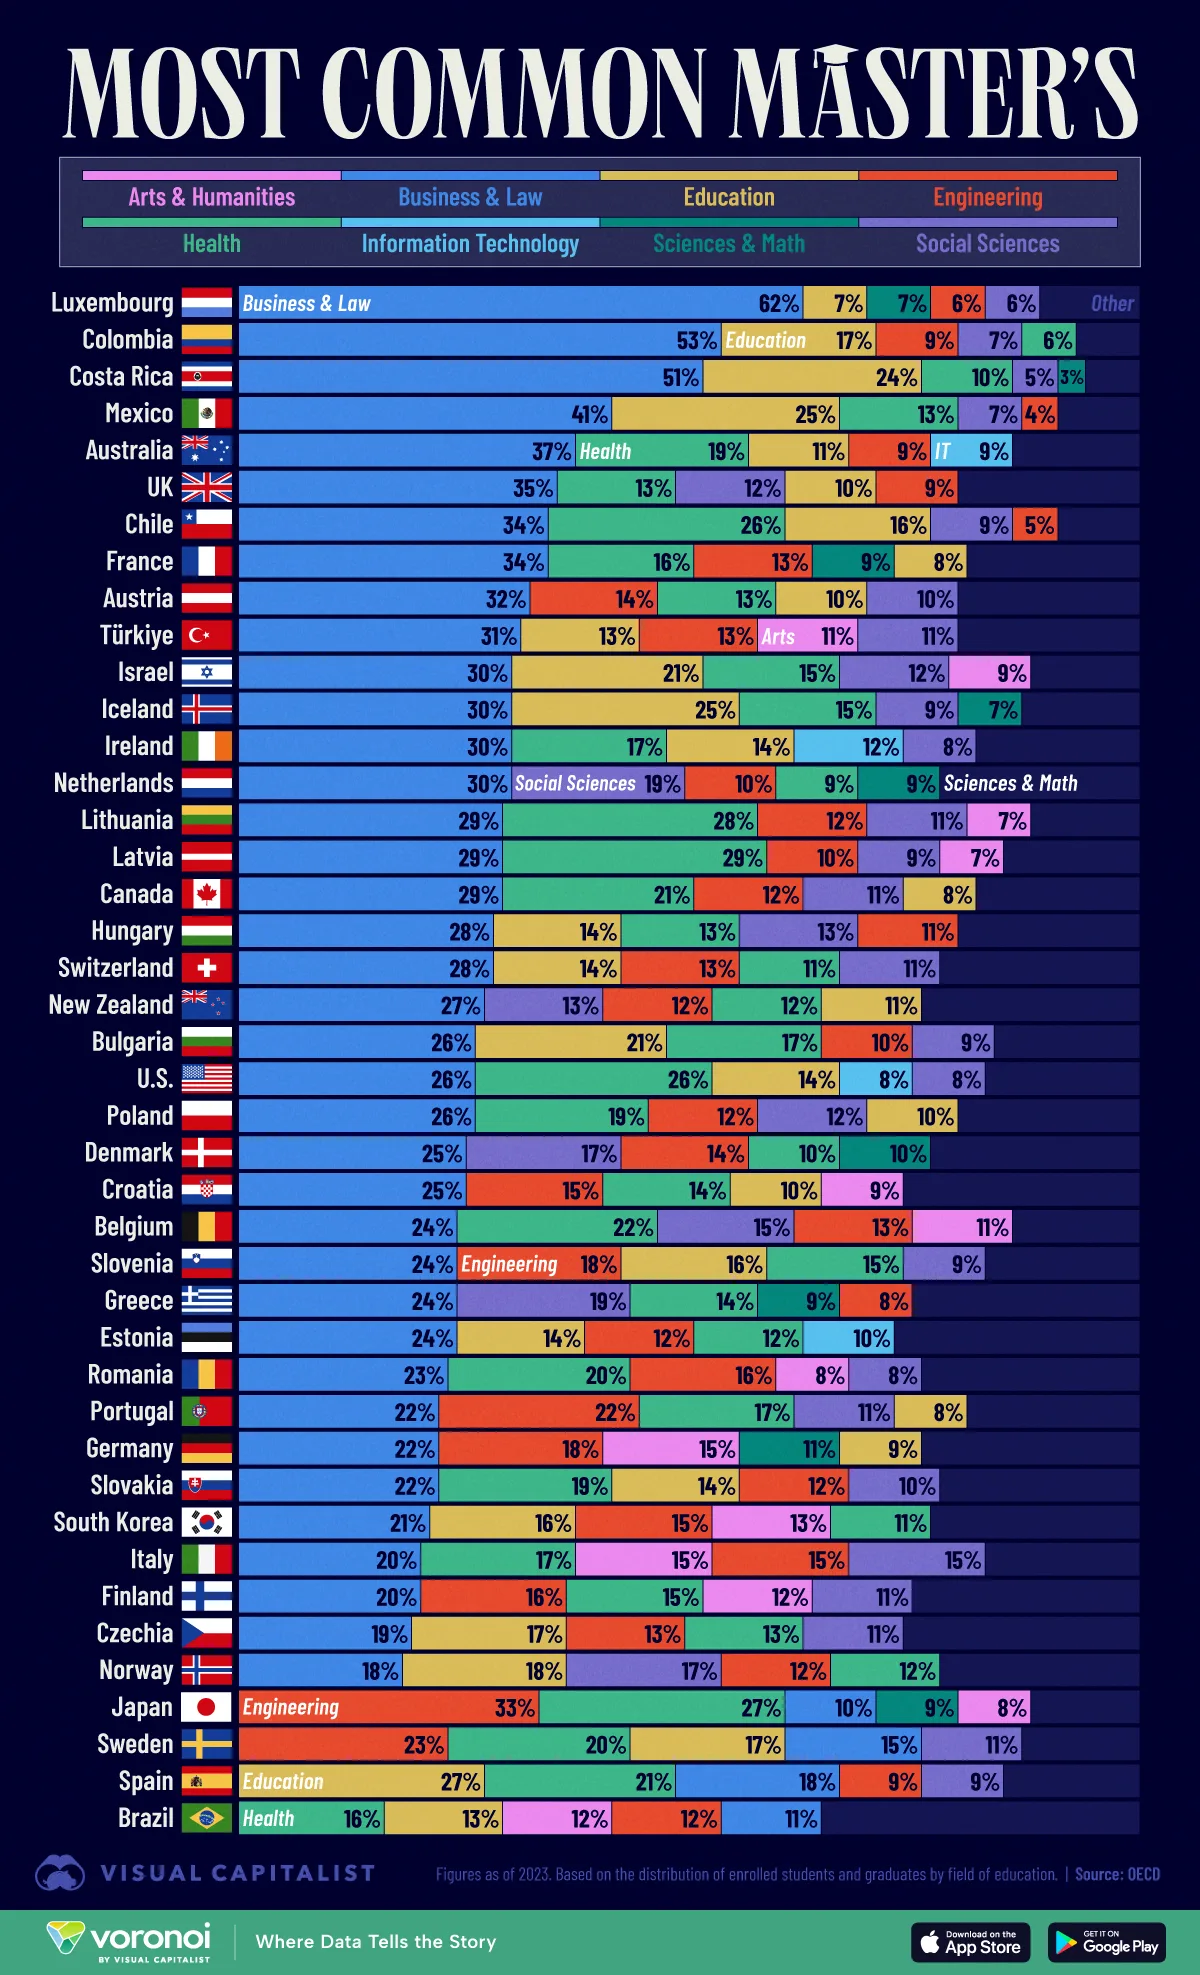
- Business & law are the most common master’s fields across 43 OECD countries.
- Certain countries diverge from the pattern, such as Japan, where engineering is the top field (33%).
According to new OECD data, the world’s graduate students are primarily focused on just a few key disciplines.
In this graphic, we visualize the most common master’s degrees in 43 countries, revealing how business and law is the most common choice globally.
A few countries buck the trend, including Japan, Sweden, Spain, and Brazil, where a larger share of graduate students specialize in fields like engineering and education.
Data & Discussion
The data for this visualization comes from OECD’s Education at a Glance 2025. It categorizes graduate students by field of study across OECD and partner countries. Each country’s figures represent the share of enrolled master’s students in each discipline.
| Country | Field of education | % of Students |
|---|---|---|
 Australia Australia |
Business & law | 37% |
| Australia |
Health | 19% |
| Australia |
Other | 15% |
| Australia |
Education | 11% |
| Australia |
Engineering | 9% |
| Australia |
Information technology | 9% |
 Austria Austria |
Business & law | 32% |
| Austria |
Other | 21% |
| Austria |
Engineering | 14% |
| Austria |
Health | 13% |
| Austria |
Education | 10% |
| Austria |
Social sciences | 10% |
 Belgium Belgium |
Business & law | 24% |
| Belgium |
Health | 22% |
| Belgium |
Other | 16% |
| Belgium |
Social sciences | 15% |
| Belgium |
Engineering | 13% |
| Belgium |
Arts and humanities | 11% |
 Brazil Brazil |
Other | 37% |
| Brazil |
Health | 16% |
| Brazil |
Education | 13% |
| Brazil |
Engineering | 12% |
| Brazil |
Arts and humanities | 12% |
| Brazil |
Business & law | 11% |
 Bulgaria Bulgaria |
Business & law | 26% |
| Bulgaria |
Education | 21% |
| Bulgaria |
Health | 17% |
| Bulgaria |
Other | 18% |
| Bulgaria |
Engineering | 10% |
| Bulgaria |
Social sciences | 9% |
 Canada Canada |
Business & law | 29% |
| Canada |
Health | 21% |
| Canada |
Other | 20% |
| Canada |
Engineering | 12% |
| Canada |
Social sciences | 11% |
| Canada |
Education | 8% |
 Chile Chile |
Business & law | 34% |
| Chile |
Health | 26% |
| Chile |
Education | 16% |
| Chile |
Other | 11% |
| Chile |
Social sciences | 9% |
| Chile |
Engineering | 5% |
 Colombia Colombia |
Business & law | 53% |
| Colombia |
Education | 17% |
| Colombia |
Other | 8% |
| Colombia |
Social sciences | 7% |
| Colombia |
Engineering | 9% |
| Colombia |
Health | 6% |
 Costa Rica Costa Rica |
Business & law | 51% |
| Costa Rica |
Education | 24% |
| Costa Rica |
Health | 10% |
| Costa Rica |
Other | 6% |
| Costa Rica |
Social sciences | 5% |
| Costa Rica |
Sciences & math | 3% |
 Croatia Croatia |
Other | 27% |
| Croatia |
Business & law | 25% |
| Croatia |
Engineering | 15% |
| Croatia |
Health | 14% |
| Croatia |
Education | 10% |
| Croatia |
Arts and humanities | 9% |
 Czechia Czechia |
Other | 27% |
| Czechia |
Business & law | 19% |
| Czechia |
Education | 17% |
| Czechia |
Engineering | 13% |
| Czechia |
Health | 13% |
| Czechia |
Social sciences | 11% |
 Denmark Denmark |
Business & law | 25% |
| Denmark |
Other | 24% |
| Denmark |
Social sciences | 17% |
| Denmark |
Engineering | 14% |
| Denmark |
Health | 10% |
| Denmark |
Sciences & math | 10% |
 Estonia Estonia |
Other | 28% |
| Estonia |
Business & law | 24% |
| Estonia |
Education | 14% |
| Estonia |
Engineering | 12% |
| Estonia |
Health | 12% |
| Estonia |
Information technology | 10% |
 Finland Finland |
Other | 27% |
| Finland |
Business & law | 20% |
| Finland |
Engineering | 16% |
| Finland |
Health | 15% |
| Finland |
Arts and humanities | 12% |
| Finland |
Social sciences | 11% |
 France France |
Business & law | 34% |
| France |
Health | 16% |
| France |
Other | 20% |
| France |
Engineering | 13% |
| France |
Sciences & math | 9% |
| France |
Education | 8% |
 Germany Germany |
Other | 25% |
| Germany |
Business & law | 22% |
| Germany |
Engineering | 18% |
| Germany |
Arts and humanities | 15% |
| Germany |
Sciences & math | 11% |
| Germany |
Education | 9% |
 Greece Greece |
Other | 26% |
| Greece |
Business & law | 24% |
| Greece |
Social sciences | 19% |
| Greece |
Health | 14% |
| Greece |
Sciences & math | 9% |
| Greece |
Engineering | 8% |
 Hungary Hungary |
Business & law | 28% |
| Hungary |
Other | 20% |
| Hungary |
Health | 13% |
| Hungary |
Social sciences | 13% |
| Hungary |
Education | 14% |
| Hungary |
Engineering | 11% |
 Iceland Iceland |
Business & law | 30% |
| Iceland |
Education | 25% |
| Iceland |
Health | 15% |
| Iceland |
Other | 14% |
| Iceland |
Social sciences | 9% |
| Iceland |
Sciences & math | 7% |
 Ireland Ireland |
Business & law | 30% |
| Ireland |
Health | 17% |
| Ireland |
Other | 20% |
| Ireland |
Education | 14% |
| Ireland |
Information technology | 12% |
| Ireland |
Social sciences | 8% |
 Israel Israel |
Business & law | 30% |
| Israel |
Education | 21% |
| Israel |
Health | 15% |
| Israel |
Other | 13% |
| Israel |
Social sciences | 12% |
| Israel |
Arts and humanities | 9% |
 Italy Italy |
Business & law | 20% |
| Italy |
Other | 19% |
| Italy |
Health | 17% |
| Italy |
Engineering | 15% |
| Italy |
Social sciences | 15% |
| Italy |
Arts and humanities | 15% |
 Japan Japan |
Engineering | 33% |
| Japan |
Health | 27% |
| Japan |
Other | 13% |
| Japan |
Business & law | 10% |
| Japan |
Sciences & math | 9% |
| Japan |
Arts and humanities | 8% |
 Korea Korea |
Other | 23% |
| Korea |
Business & law | 21% |
| Korea |
Education | 16% |
| Korea |
Engineering | 15% |
| Korea |
Health | 11% |
| Korea |
Arts and humanities | 13% |
 Latvia Latvia |
Business & law | 29% |
| Latvia |
Health | 29% |
| Latvia |
Other | 16% |
| Latvia |
Engineering | 10% |
| Latvia |
Social sciences | 9% |
| Latvia |
Arts and humanities | 7% |
 Lithuania Lithuania |
Business & law | 29% |
| Lithuania |
Health | 28% |
| Lithuania |
Other | 14% |
| Lithuania |
Engineering | 12% |
| Lithuania |
Social sciences | 11% |
| Lithuania |
Arts and humanities | 7% |
 Luxembourg Luxembourg |
Business & law | 62% |
| Luxembourg |
Other | 12% |
| Luxembourg |
Education | 7% |
| Luxembourg |
Sciences & math | 7% |
| Luxembourg |
Engineering | 6% |
| Luxembourg |
Social sciences | 6% |
 Mexico Mexico |
Business & law | 41% |
| Mexico |
Education | 25% |
| Mexico |
Health | 13% |
| Mexico |
Other | 10% |
| Mexico |
Social sciences | 7% |
| Mexico |
Engineering | 4% |
 Netherlands Netherlands |
Business & law | 30% |
| Netherlands |
Other | 22% |
| Netherlands |
Social sciences | 19% |
| Netherlands |
Engineering | 10% |
| Netherlands |
Sciences & math | 9% |
| Netherlands |
Health | 9% |
 New Zealand New Zealand |
Business & law | 27% |
| New Zealand |
Other | 25% |
| New Zealand |
Social sciences | 13% |
| New Zealand |
Health | 12% |
| New Zealand |
Engineering | 12% |
| New Zealand |
Education | 11% |
 Norway Norway |
Other | 22% |
| Norway |
Business & law | 18% |
| Norway |
Education | 18% |
| Norway |
Social sciences | 17% |
| Norway |
Health | 12% |
| Norway |
Engineering | 12% |
 Poland Poland |
Business & law | 26% |
| Poland |
Health | 19% |
| Poland |
Other | 22% |
| Poland |
Engineering | 12% |
| Poland |
Social sciences | 12% |
| Poland |
Education | 10% |
 Portugal Portugal |
Business & law | 22% |
| Portugal |
Engineering | 22% |
| Portugal |
Other | 20% |
| Portugal |
Health | 17% |
| Portugal |
Social sciences | 11% |
| Portugal |
Education | 8% |
 Romania Romania |
Other | 26% |
| Romania |
Business & law | 23% |
| Romania |
Health | 20% |
| Romania |
Engineering | 16% |
| Romania |
Social sciences | 8% |
| Romania |
Arts and humanities | 8% |
 Slovak Republic Slovak Republic |
Other | 23% |
| Slovak Republic |
Business & law | 22% |
| Slovak Republic |
Health | 19% |
 Slovak Republic Slovak Republic |
Education | 14% |
| Slovak Republic |
Engineering | 12% |
| Slovak Republic |
Social sciences | 10% |
 Slovenia Slovenia |
Business & law | 24% |
| Slovenia |
Engineering | 18% |
| Slovenia |
Health | 15% |
| Slovenia |
Education | 16% |
| Slovenia |
Social sciences | 9% |
| Slovenia |
Other | 19% |
 Spain Spain |
Education | 27% |
| Spain |
Health | 21% |
| Spain |
Other | 17% |
| Spain |
Business & law | 18% |
| Spain |
Social sciences | 9% |
| Spain |
Engineering | 9% |
 Sweden Sweden |
Engineering | 23% |
| Sweden |
Health | 20% |
| Sweden |
Education | 17% |
| Sweden |
Business & law | 15% |
| Sweden |
Social sciences | 11% |
| Sweden |
Other | 15% |
 Switzerland Switzerland |
Business & law | 28% |
| Switzerland |
Other | 24% |
| Switzerland |
Engineering | 13% |
| Switzerland |
Health | 11% |
| Switzerland |
Social sciences | 11% |
| Switzerland |
Education | 14% |
 Türkiye Türkiye |
Business & law | 31% |
| Türkiye |
Other | 22% |
| Türkiye |
Education | 13% |
| Türkiye |
Engineering | 13% |
| Türkiye |
Social sciences | 11% |
| Türkiye |
Arts and humanities | 11% |
 U.S. U.S. |
Business & law | 26% |
| U.S. |
Health | 26% |
| U.S. |
Other | 19% |
| U.S. |
Education | 14% |
| U.S. |
Information technology | 8% |
| U.S. |
Social sciences | 8% |
 UK UK |
Business & law | 35% |
| UK |
Health | 13% |
| UK |
Other | 21% |
| UK |
Social sciences | 12% |
| UK |
Education | 10% |
| UK |
Engineering | 9% |
Business & Law Are the Most Common Master’s Fields
From Australia to Colombia, business and law attracts the largest share of graduate students around the world. These programs are often linked to high employability and upper-level management roles, particularly in service-oriented economies.
This trend also spans across developed (e.g. Luxembourg) and developing (e.g. Mexico) economies, highlighting the universal career-advancing potential of an MBA.
Nations Bucking the Trend
We can identify several countries where business and law is not the clear favorite.
In Spain and Norway, for instance, education-related master’s programs are equally or more popular. Health fields also represent a major share in countries like the U.S. and Japan, possibly driven by their aging populations and growing healthcare demand.
And lastly, Japan and Sweden stand out as the only countries in this sample where engineering fields are the most popular choice for graduate students.
These differences could boil down to cultural factors, institutional incentives, or simply greater employment opportunities.
Learn More on the Voronoi App 
If you enjoyed today’s post, check out The Median Annual Salary by Education Level on Voronoi, the new app from Visual Capitalist.
- Source: https://www.visualcapitalist.com/visualized-the-most-common-masters-degrees-in-43-countries/