Visualizing America’s $1.8 Trillion Federal Deficit
This was originally posted on our Voronoi app. Download the app for free on iOS or Android and discover incredible data-driven charts from a variety of trusted sources.
Key Takeaways
- America’s federal deficit in FY2024 has grown to $1.83 trillion, up from $1.7 trillion the previous fiscal year
- Debt interest payments have become one of the biggest spending categories, totaling $882 billion
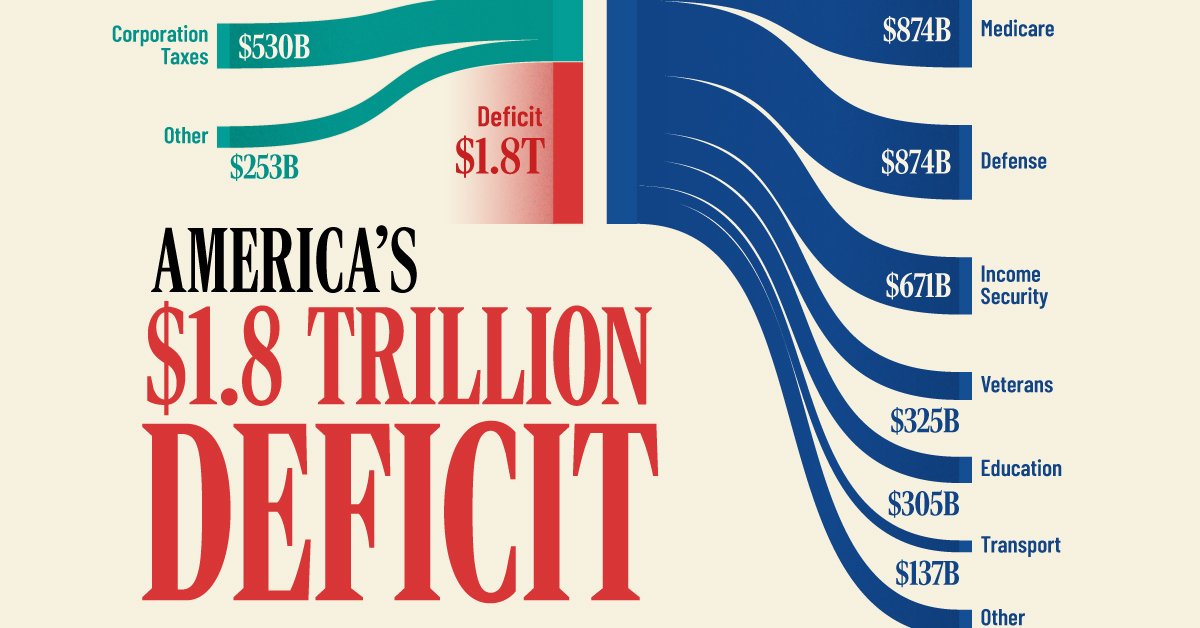
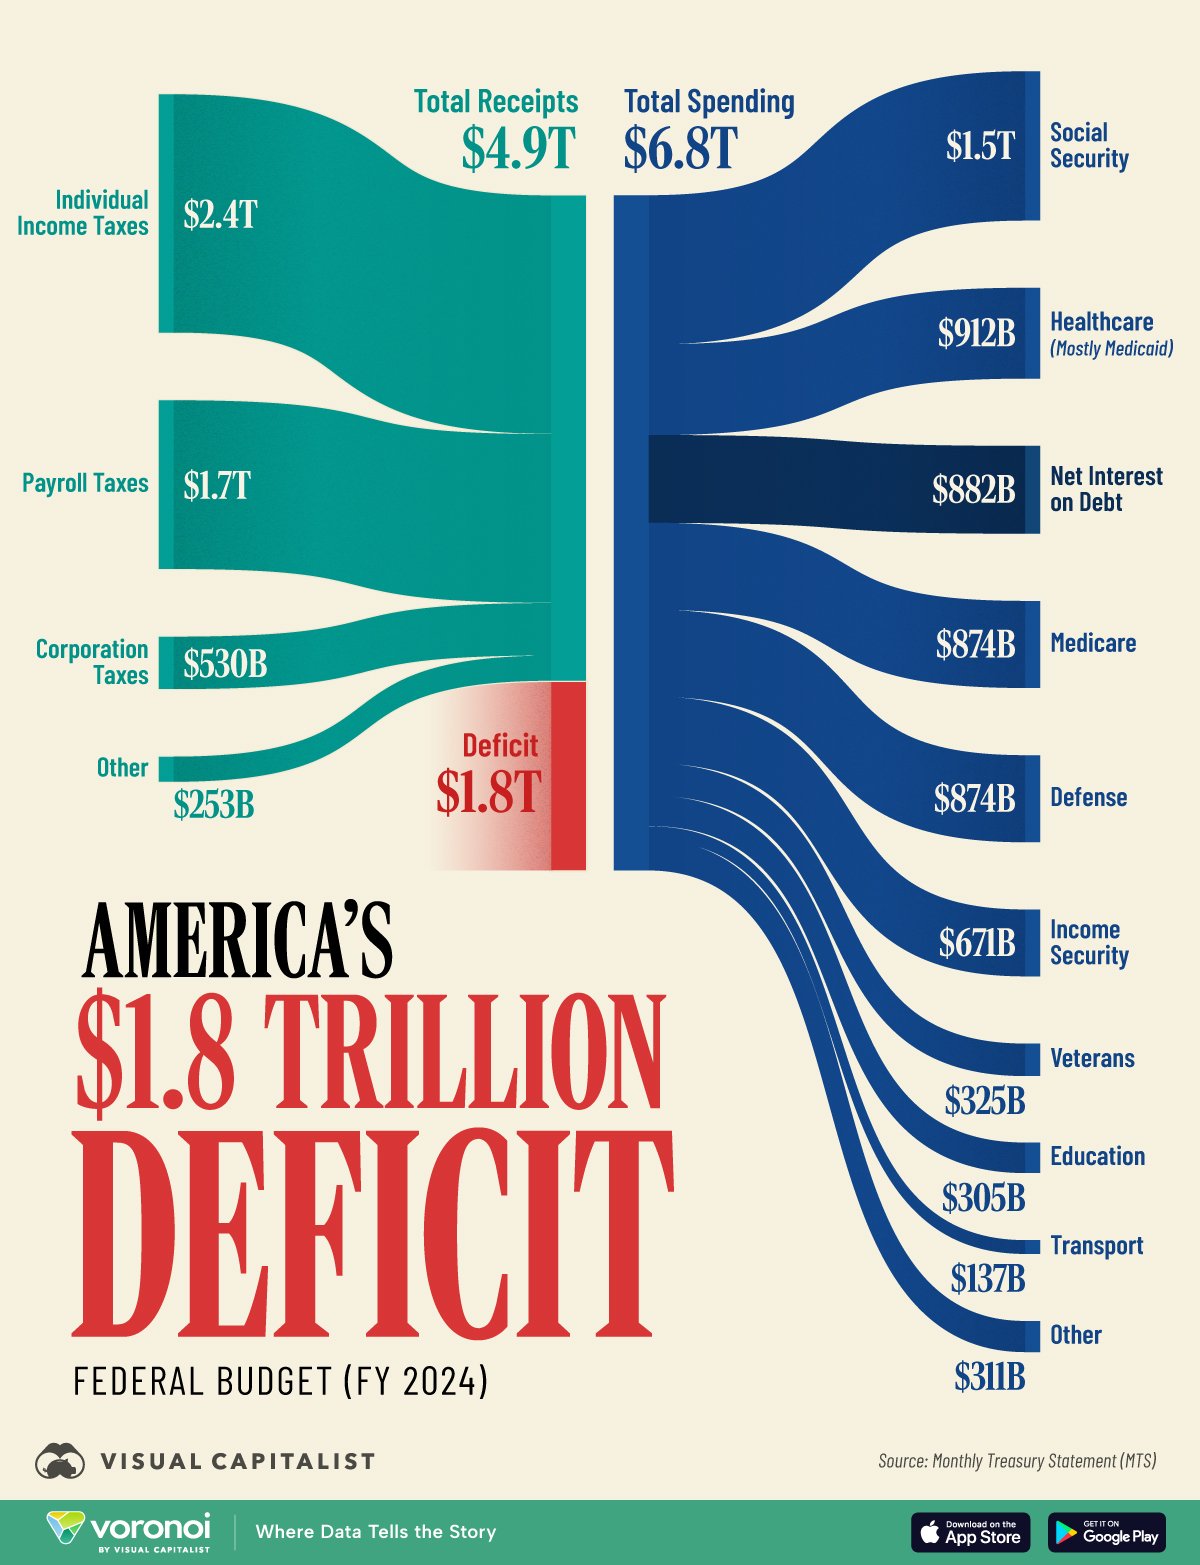
In fiscal year 2024, the U.S. federal government recorded a staggering deficit of $1.83 trillion—the third-largest in history outside the pandemic era.
Although the government collected $4.9 trillion in revenue, it also spent a massive $6.8 trillion, driven by rising Social Security, Healthcare, and Net Interest costs.
In this infographic, we dissect the federal budget, highlighting the widening gap between income and expenditures.
Data & Discussion
The figures we used to create this graphic were sourced from FiscalData.Treasury.gov.
| Category | Value |
|---|---|
| Total Receipts | $4,920,000,000,000 |
 Individual Income Taxes Individual Income Taxes |
$2,400,000,000,000 |
 Payroll Taxes Payroll Taxes |
$1,700,000,000,000 |
 Corporation Taxes Corporation Taxes |
$530,000,000,000 |
 Other Other |
$253,000,000,000 |
| Total Spending | $6,750,000,000,000 |
 Social Security Social Security |
$1,500,000,000,000 |
 Healthcare (Mostly Medicaid) Healthcare (Mostly Medicaid) |
$912,000,000,000 |
 Net Interest on Debt Net Interest on Debt |
$882,000,000,000 |
 Medicare Medicare |
$874,000,000,000 |
 Defense Defense |
$874,000,000,000 |
| Income Security |
$671,000,000,000 |
 Veterans Veterans |
$325,000,000,000 |
 Education Education |
$305,000,000,000 |
 Transport Transport |
$137,000,000,000 |
| Other |
$311,000,000,000 |
| Deficit | $1,830,000,000,000 |
Because the federal government spent more than it brought in through taxes, the country is left with a $1.83 trillion federal deficit. To learn more, let’s look closer at the federal government’s three biggest categories of spending.
Social Security
Social Security is the largest single line item in the federal budget due to the combination of longer life expectancies and an aging population.
The number of beneficiaries is growing quickly as Baby Boomers retire, even outpacing contributions from the current workforce.
Projections indicate that, without legislative changes, the Social Security Trust Fund may be depleted by the mid-2030s, potentially leading to benefit reductions of about 22% unless reforms are enacted.
Medicaid
Factors driving Medicaid spending include higher-than-anticipated enrollment and increased healthcare costs.
The program continues to support over 80 million Americans, including low-income families, seniors, and individuals with disabilities. Recent legislative proposals aim to reduce federal Medicaid spending by up to $880 billion over the next decade, which could impact coverage for millions of beneficiaries.
Net Interest on Debt
The federal government’s interest payments on the national debt hit a record high in FY2024, nearly tripling from 2020 levels ($882 billion vs $345 billion).
Interest payments now exceed the defense budget, and are expected to reach $1 trillion annually in the near future. This unprecedented growth is due to the combination of regular government overspending and higher interest rates (which were introduced to combat inflation).
Learn More on the Voronoi App 
If you enjoyed today’s post, check out the Top 20 Countries Holding the Most U.S. Debt on Voronoi, the new app from Visual Capitalist.