Warren Buffett vs. the S&P 500: Growth of $100 (1965–2025)
See visuals like this from many other data creators on our Voronoi app. Download it for free on iOS or Android and discover incredible data-driven charts from a variety of trusted sources.
Key Takeaways
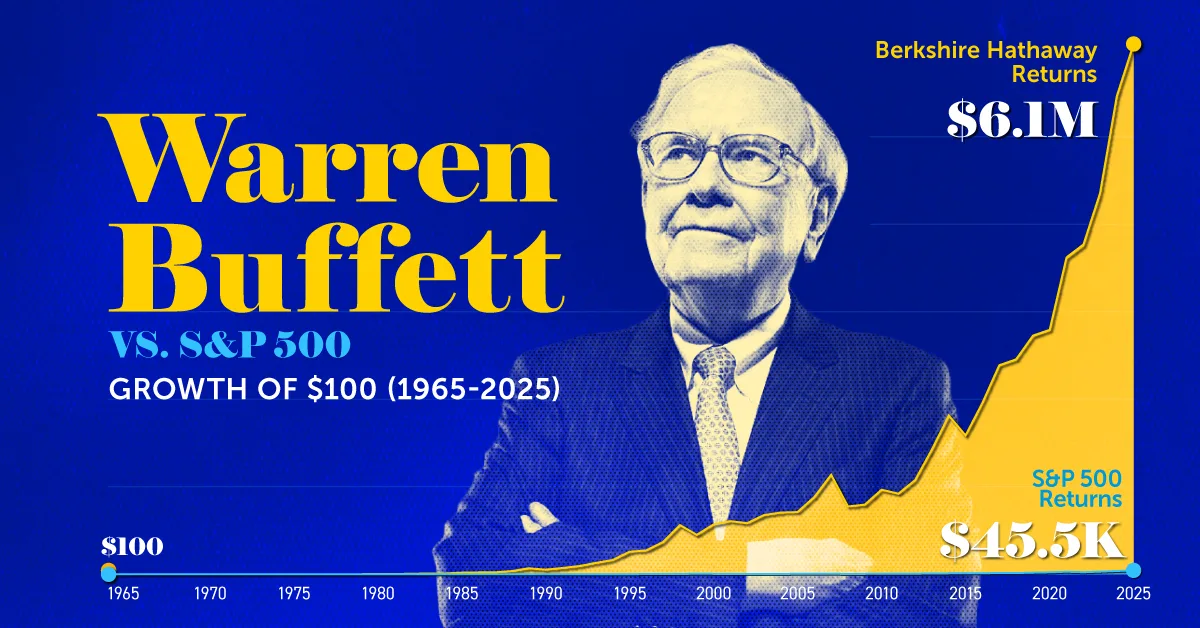
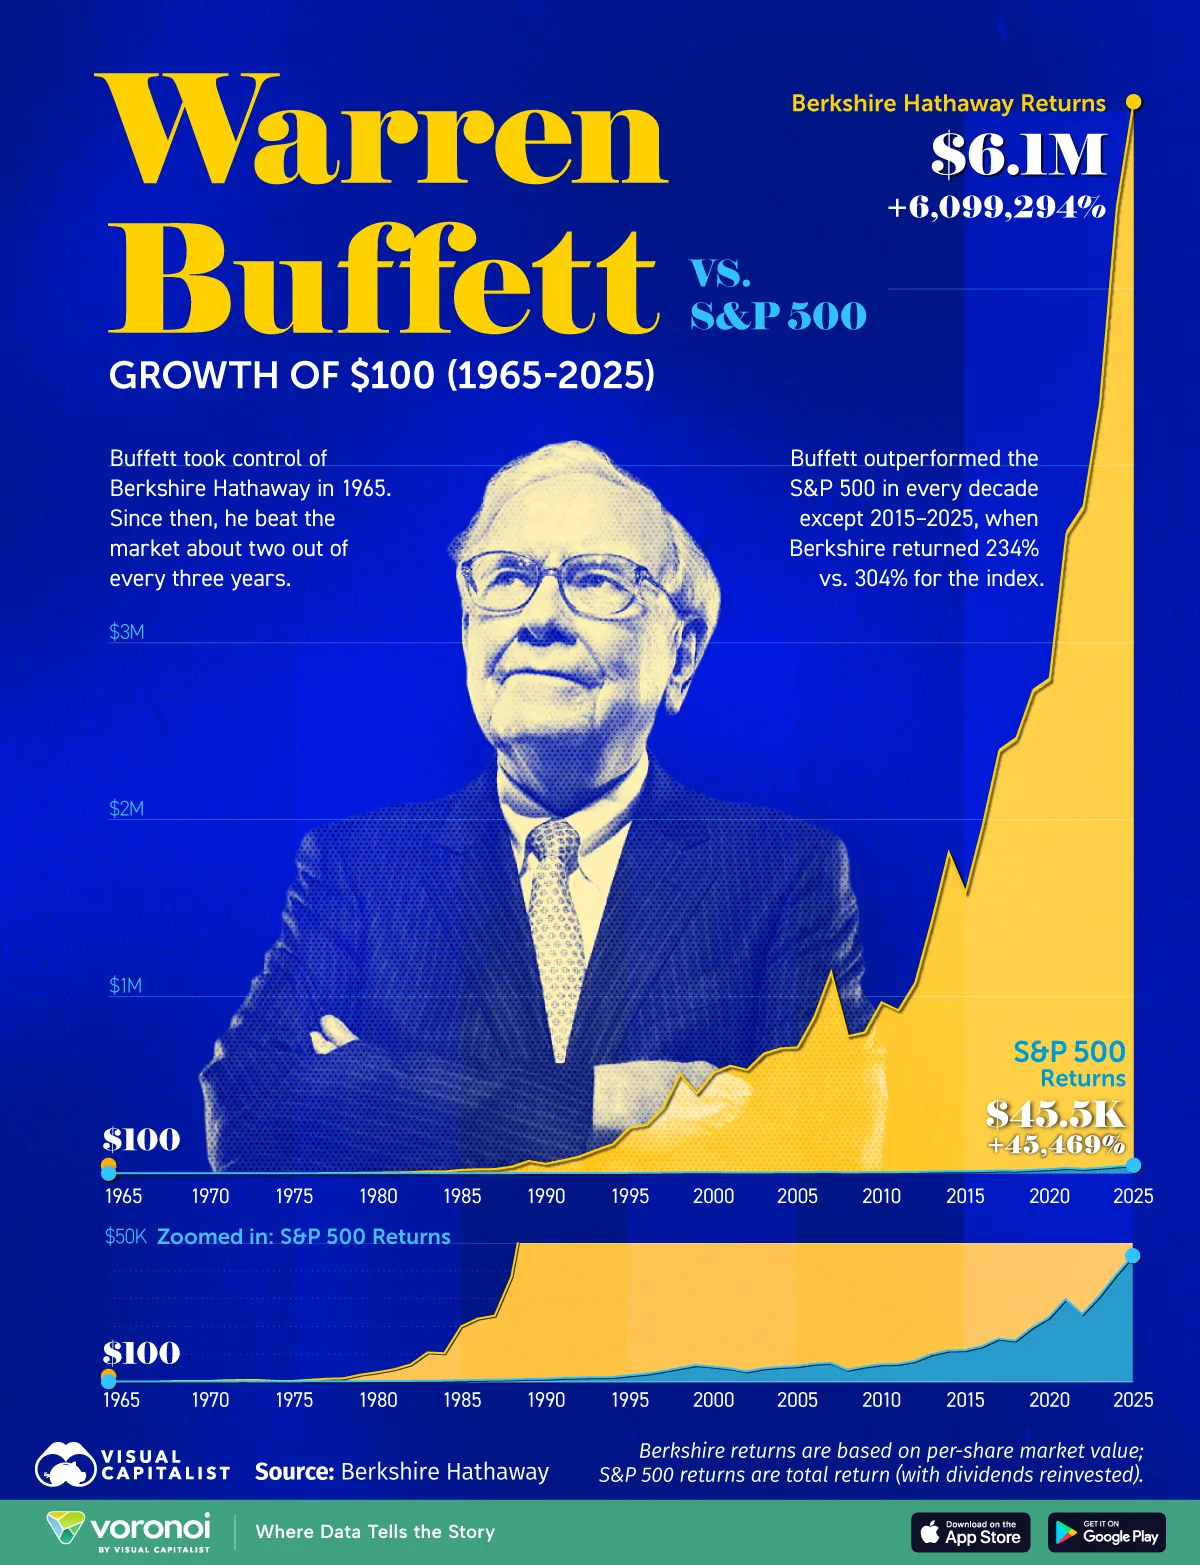
- A $100 investment in Berkshire Hathaway at the start of 1965 would be worth roughly $6.1 million by the end of 2025, versus about $45.5k for the S&P 500.
- Berkshire compounded at 19.7% annually, nearly twice the S&P 500’s 10.5%.
- Buffett’s edge was not just consistency, but the much larger average gains Berkshire delivered in its positive years.
Anyone lucky enough to invest $100 in Berkshire Hathaway at the start of 1965 would be sitting on significant returns, but just how much would they have outperformed the S&P 500?
This graphic compares Berkshire Hathaway and the S&P 500 from 1965 to 2025, based on data from Berkshire Hathaway’s 2025 annual report.
Berkshire Hathaway’s Returns Compared to the Market
A $100 investment in Berkshire Hathaway in 1965 would be worth $6.1 million investment at the end of 2025, significantly outperforming the S&P 500’s dollar return of $45,500.
The data table below shows the performance of Berkshire Hathaway between 1965 and 2025 versus the S&P 500 index.
Berkshire figures are based on per-share market value, while S&P 500 numbers are total returns with dividends reinvested.
| Year | $100 invested in Berkshire Hathaway in 1965 | $100 invested in the S&P 500 in 1965 | Berkshire Hathaway Annual Return | S&P 500 Annual Return |
|---|---|---|---|---|
| 1964 | $100 | $100 | 0.0% | 0.0% |
| 1965 | $150 | $110 | 50.0% | 10.0% |
| 1966 | $144 | $97 | -4.0% | -11.8% |
| 1967 | $164 | $127 | 13.9% | 30.9% |
| 1968 | $291 | $141 | 77.4% | 11.0% |
| 1969 | $347 | $129 | 19.2% | -8.5% |
| 1970 | $331 | $134 | -4.6% | 3.9% |
| 1971 | $598 | $154 | 80.7% | 14.9% |
| 1972 | $647 | $183 | 8.2% | 18.8% |
| 1973 | $630 | $156 | -2.6% | -14.8% |
| 1974 | $323 | $115 | -48.7% | -26.3% |
| 1975 | $331 | $157 | 2.5% | 36.5% |
| 1976 | $760 | $195 | 129.6% | 24.2% |
| 1977 | $1,116 | $180 | 46.8% | -7.7% |
| 1978 | $1,278 | $192 | 14.5% | 6.7% |
| 1979 | $2,587 | $227 | 102.4% | 18.2% |
| 1980 | $3,436 | $300 | 32.8% | 32.2% |
| 1981 | $4,529 | $285 | 31.8% | -5.0% |
| 1982 | $6,267 | $346 | 38.4% | 21.4% |
| 1983 | $10,592 | $423 | 69.0% | 22.3% |
| 1984 | $10,306 | $449 | -2.7% | 6.1% |
| 1985 | $19,963 | $591 | 93.7% | 31.6% |
| 1986 | $22,797 | $701 | 14.2% | 18.6% |
| 1987 | $23,846 | $737 | 4.6% | 5.1% |
| 1988 | $37,987 | $859 | 59.3% | 16.6% |
| 1989 | $70,124 | $1,131 | 84.6% | 31.7% |
| 1990 | $53,925 | $1,096 | -23.1% | -3.1% |
| 1991 | $73,123 | $1,431 | 35.6% | 30.6% |
| 1992 | $94,913 | $1,539 | 29.8% | 7.5% |
| 1993 | $131,834 | $1,695 | 38.9% | 10.1% |
| 1994 | $164,793 | $1,717 | 25.0% | 1.3% |
| 1995 | $259,384 | $2,362 | 57.4% | 37.6% |
| 1996 | $275,466 | $2,906 | 6.2% | 23.0% |
| 1997 | $371,604 | $3,876 | 34.9% | 33.4% |
| 1998 | $565,581 | $4,985 | 52.2% | 28.6% |
| 1999 | $453,030 | $6,032 | -19.9% | 21.0% |
| 2000 | $573,537 | $5,483 | 26.6% | -9.1% |
| 2001 | $610,816 | $4,830 | 6.5% | -11.9% |
| 2002 | $587,605 | $3,763 | -3.8% | -22.1% |
| 2003 | $680,447 | $4,843 | 15.8% | 28.7% |
| 2004 | $709,706 | $5,371 | 4.3% | 10.9% |
| 2005 | $715,384 | $5,634 | 0.8% | 4.9% |
| 2006 | $887,791 | $6,524 | 24.1% | 15.8% |
| 2007 | $1,142,588 | $6,883 | 28.7% | 5.5% |
| 2008 | $779,245 | $4,336 | -31.8% | -37.0% |
| 2009 | $800,284 | $5,485 | 2.7% | 26.5% |
| 2010 | $971,545 | $6,313 | 21.4% | 15.1% |
| 2011 | $925,883 | $6,446 | -4.7% | 2.1% |
| 2012 | $1,081,431 | $7,477 | 16.8% | 16.0% |
| 2013 | $1,435,059 | $9,900 | 32.7% | 32.4% |
| 2014 | $1,822,525 | $11,256 | 27.0% | 13.7% |
| 2015 | $1,594,709 | $11,414 | -12.5% | 1.4% |
| 2016 | $1,967,871 | $12,783 | 23.4% | 12.0% |
| 2017 | $2,398,835 | $15,570 | 21.9% | 21.8% |
| 2018 | $2,466,002 | $14,885 | 2.8% | -4.4% |
| 2019 | $2,737,262 | $19,574 | 11.0% | 31.5% |
| 2020 | $2,802,957 | $23,176 | 2.4% | 18.4% |
| 2021 | $3,632,632 | $29,827 | 29.6% | 28.7% |
| 2022 | $3,777,937 | $24,428 | 4.0% | -18.1% |
| 2023 | $4,374,851 | $30,853 | 15.8% | 26.3% |
| 2024 | $5,490,438 | $38,566 | 25.5% | 25.0% |
| 2025 | $6,088,896 | $45,469 | 10.9% | 17.9% |
Warren Buffett delivered a return of more than 6,088,000% on Berkshire’s stock as he transformed a struggling textile maker into the most valuable company in the world that isn’t either a tech giant or a state oil producer.
Put differently, the world’s greatest investor turned the same initial investment of just $100 into about 134 times as much wealth as the broader market over the same six-decade span.
How Warren Buffett Outperformed the S&P 500
The formula behind the success is simple in theory, but incredibly difficult in practice: buy high-quality businesses at attractive prices.
The 95-year-old legendary value investor is not afraid to accumulate large positions in companies he likes and then hold them “forever”.
Examples include American Express, first purchased in 1964; Coca-Cola in 1988; Moody’s in 2000; and Apple in 2016, all of which remain part of Berkshire’s portfolio.
Berkshire’s structure as a publicly traded holding company allowed shareholders to compound wealth alongside him without paying recurring management or performance fees.
Had Buffett charged hedge-fund-style fees, the ending value would likely have been only a few hundred thousand dollars rather than $6.1 million, depending on the exact fee model used.
Did Buffett Beat the Market Consistently?
Over the 61-year period, Berkshire posted positive returns in 50 years—slightly more often than the S&P 500. More importantly, its gains were much larger in winning years, averaging 32% versus 19% for the index.
Despite this long-term dominance, Buffett did experience periods of underperformance.
While Buffett outperformed the S&P 500 in every decade from 1965 to 2015, from 2015 to 2025 the S&P 500 returned 304% compared to Berkshire Hathaway’s 234%.
As the world’s largest public conglomerate, Berkshire’s sheer size—combined with a long bull market led by mega-cap AI stocks—has made it harder for the Oracle of Omaha to find great companies at attractive prices.
Many of the market’s biggest AI winners, like Nvidia, Meta, and Palantir, also fall outside his “circle of competence”.
Even so, Buffett’s long-term record of outsized returns is arguably the most extraordinary example of wealth creation in financial market history, helping cement his place among the world’s richest people.
Learn More on the Voronoi App 
To learn more about legendary money managers check out this graphic which visualizes Jim Simons’ Medallion Fund’s returns vs. the S&P 500.