
The ocean has always done the heavy lifting when it comes to absorbing the consequences of human activity. It soaks up carbon dioxide, moderates temperatures, and keeps the planet from cooking faster than it already is. But 2023 pushed that relationship to a breaking point. According to a peer-reviewed study published in Advances in Atmospheric Sciences, the world’s oceans absorbed more heat last year than at any point in recorded history, storing the equivalent of roughly 40 times the total energy consumed by every human on Earth in a single year. That number is almost too large to hold in your head.
It is not a fluke. Ocean heat content has broken records for several consecutive years, and 2023 was simply the year the numbers became undeniable. For anyone trying to understand what this means for sea life, coastal communities, and the climate system as a whole, the picture is both fascinating and deeply unsettling.
How scientists actually measure ocean heat

Measuring the temperature of something as vast as the oceans of the world is genuinely difficult work. Researchers rely primarily on a global network of robotic floats called Argo, which dive to depths of around 2,000 meters, record temperature and salinity data, and then resurface to transmit readings via satellite. The Argo program currently maintains roughly 4,000 active floats spread across ocean basins worldwide.
Ocean heat content (OHC) is measured in zettajoules (ZJ), a unit that helps scientists compare heat storage across the enormous volume of seawater on this planet. The 2023 study, led by researchers at the Institute of Atmospheric Physics of the Chinese Academy of Sciences and co-authored by scientists from NOAA and several European universities, reported that the upper 2,000 meters of the global ocean stored approximately 287 ZJ above the 1981-2010 average. The International Energy Agency estimated that total global energy consumption in 2022 was around 620 exajoules (0.62 ZJ). The ocean absorbed roughly 15 ZJ more than the previous record year in 2022 alone.
Every ocean basin set its own record. The North Atlantic, the Mediterranean, and the Southern Ocean all saw unprecedented warming. That kind of synchronicity across separate basins tells scientists this is a global signal, not a regional anomaly.
Why the ocean absorbs so much heat in the first place
Water has an exceptionally high heat capacity compared to land or air, which means it can absorb large amounts of energy without dramatic temperature swings at the surface. This physical property has made oceans the planet’s primary climate buffer since industrialization began. According to NOAA, the ocean has absorbed more than 90 percent of the excess heat trapped by greenhouse gases since the mid-twentieth century.
That buffering role has slowed surface warming significantly. Without it, average air temperatures would be far higher than they are today. But the heat that enters the ocean does not disappear. It alters water density, drives circulation, fuels hurricanes, bleaches coral, and raises sea levels through thermal expansion.
The increase in ocean heatwaves is one of the most visible consequences. Marine heatwaves have tripled in duration since the 1980s according to research published in Nature Climate Change.
What the record heat means for marine ecosystems

Warmer water holds less dissolved oxygen, which stresses fish, invertebrates, and the microscopic organisms at the base of marine food webs. Coral reefs are particularly sensitive. When sea surface temperatures climb even one or two degrees Celsius above normal summer maximums for several weeks, corals expel the symbiotic algae that give them color and nutrition, a process called bleaching. Prolonged bleaching kills reefs.
The Great Barrier Reef experienced its most widespread bleaching event on record in 2024, affecting approximately 73 percent of surveyed reefs according to the Australian Institute of Marine Science. Coral reef decline is accelerating in ways that suggest some ecosystems may not survive another decade of business-as-usual emissions.
Beyond reefs, warmer oceans are shifting the geographic ranges of fish species, disrupting fisheries that millions of people depend on for protein and income. Phytoplankton, the microscopic plants that produce roughly half of Earth’s oxygen, are declining in some regions as the ocean stratifies and nutrient-rich deep water becomes harder to mix upward.
A snapshot of the numbers: ocean heat content by basin
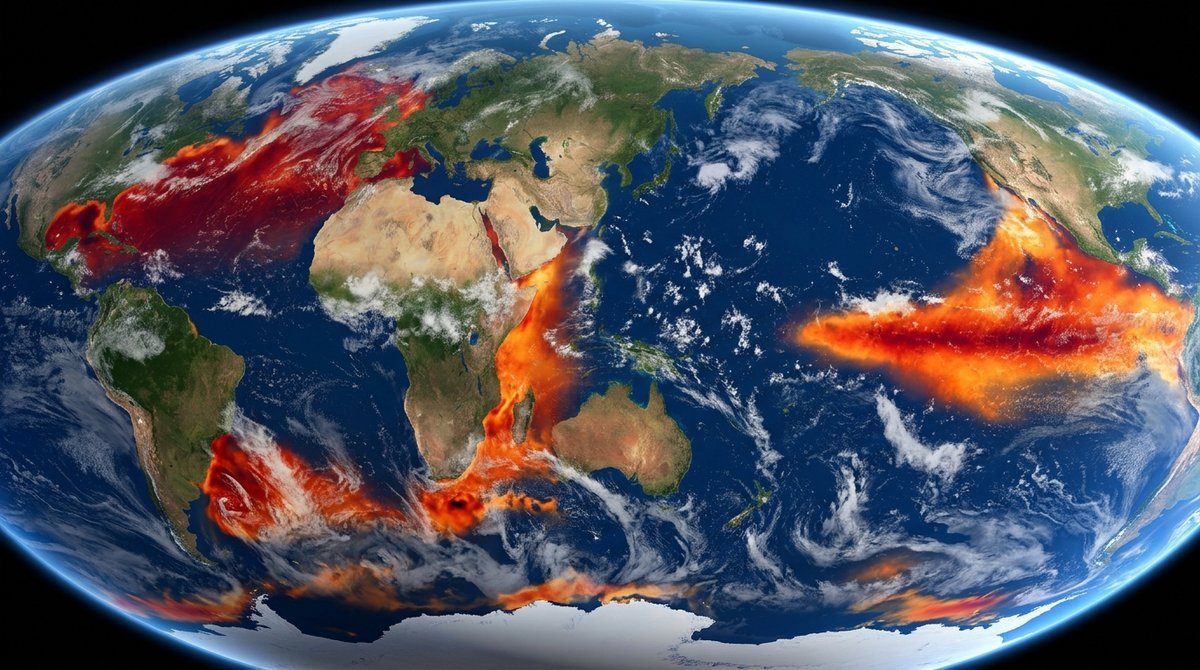
The table below summarizes record ocean heat content anomalies reported for 2023 across major basins, drawn from the IAP dataset as cited in the 2024 Advances in Atmospheric Sciences study by Cheng et al.
| Ocean Basin | 2023 Record Status (IAP dataset, Cheng et al. 2024) |
|---|---|
| North Atlantic Ocean | All-time record high OHC |
| South Atlantic Ocean | All-time record high OHC |
| Indian Ocean | All-time record high OHC |
| Southern Ocean | All-time record high OHC |
| Mediterranean Sea | All-time record high OHC |
| Pacific Ocean (North and South) | Near-record or record high OHC |
Understanding which basins are warming fastest matters when you look at an oceans of the world map, because basin-level changes drive regional weather, storm intensity, and sea level rise in very specific ways. The five oceans of the world recognized by the International Hydrographic Organization (Pacific, Atlantic, Indian, Arctic, and Southern) each play distinct roles in global heat distribution and atmospheric circulation.
The connection to sea level rise and extreme weather

Ocean warming drives sea level rise through two mechanisms: thermal expansion of seawater and accelerated melting of glaciers and ice sheets. NASA satellite altimetry data shows that global mean sea level has risen approximately 100 millimeters since 1993, with the rate of rise accelerating in recent decades.
Warmer seas also intensify tropical storms. A hurricane drawing energy from a hot ocean surface has more fuel available, which can translate to faster intensification and stronger peak winds. Several Atlantic storms in 2023 intensified rapidly, a pattern scientists attribute in part to anomalously warm sea surface temperatures. As global energy demand climbs through 2035, emissions trajectories suggest ocean warming will continue unless the energy mix shifts dramatically toward clean sources.
Key facts about ocean heat and the global climate system
- The ocean has absorbed more than 90 percent of the excess heat from greenhouse gas emissions since industrialization, according to NOAA.
- The 2023 global ocean heat content record was approximately 287 zettajoules above the 1981-2010 baseline in the upper 2,000 meters, per Cheng et al. (2024).
- Marine heatwaves have tripled in average duration since the 1980s, according to research published in Nature Climate Change.
- Global mean sea level rose approximately 100 millimeters between 1993 and 2023, with thermal expansion as a key contributor, per NASA satellite altimetry records.
- Every major ocean basin set an all-time heat record in 2023, per the IAP dataset cited in Cheng et al. (2024).
Efforts to protect ocean ecosystems at a policy level have gained some momentum. The historic global ocean protection treaty adopted in 2023 aims to designate 30 percent of the world’s ocean area as marine protected zones by 2030. Whether that framework translates into enforceable, real-world protections remains to be seen, but its adoption marked a meaningful shift in international recognition of ocean vulnerability.
None of this means the ocean is beyond saving. It is, however, a clear signal that the margin for inaction is gone. The heat stored in the deep blue is not an abstraction. It is reshaping the physical world in ways that will take decades to fully register at the surface of daily life.
Frequently asked questions about ocean heat and world oceans
How many oceans are in the world, and which one is warming fastest?
The International Hydrographic Organization recognizes five oceans of the world: the Pacific, Atlantic, Indian, Arctic, and Southern. The 7 oceans framework sometimes referenced in geography education subdivides those further into the North Pacific, South Pacific, North Atlantic, South Atlantic, Indian, Arctic, and Southern. In 2023, the North Atlantic and the Southern Ocean showed particularly dramatic warming, both setting all-time heat content records according to the IAP dataset (Cheng et al., 2024).
What is ocean heat content and why does it matter more than sea surface temperature?
Sea surface temperature measures warmth at the very top layer, which fluctuates with weather patterns. Ocean heat content measures total energy stored through the water column, often to depths of 2,000 meters. It is a more stable and comprehensive indicator of long-term climate change because it reflects accumulated warming rather than short-term variation. It also directly drives sea level rise through thermal expansion.
Why did 2023 set such a large ocean heat record?
- Long-term accumulation of greenhouse gas-driven warming in the ocean system, building for decades.
- A transition from La Nina to El Nino conditions in the Pacific, which reduced the cooling effect La Nina had been providing since 2020.
- Reductions in aerosol pollution from international shipping regulations may have slightly reduced sunlight-reflecting particles over the ocean, though the magnitude of this effect is still under active research.
- Record low sea ice in Antarctica, which exposed darker open water that absorbs more solar radiation than reflective ice.
How does ocean warming affect people who don’t live near the coast?
Warmer oceans alter atmospheric circulation patterns that influence rainfall, drought, and storm tracks far inland. The jet stream and monsoon systems are sensitive to ocean temperature gradients. Disruptions can shift precipitation zones, intensify heatwaves in continental interiors, and affect agricultural yields in regions thousands of kilometers from any coastline.
What does an oceans of the world map tell us about heat distribution?
A world map with oceans color-coded by sea surface temperature anomaly shows clearly that warming is not uniform. Tropical and subtropical regions tend to show persistent warm anomalies, while polar regions see the most dramatic swings. The map format helps communicate regional risks: coastal nations bordering the North Atlantic or Southern Ocean face different fisheries and storm impacts than those bordering the Arctic Ocean.
Sources
- Cheng, L., et al. (2024). “Another Record: Ocean Warming Continues through 2023 despite El Niño Conditions.” Advances in Atmospheric Sciences. https://link.springer.com/article/10.1007/s00376-024-3378-5
- NOAA National Centers for Environmental Information. (2024). “Ocean Heat Content.” https://www.ncei.noaa.gov/access/monitoring/global-ocean-heat-content/
- International Energy Agency. (2023). “World Energy Outlook 2023.” https://www.iea.org/reports/world-energy-outlook-2023
- NASA Goddard Space Flight Center. (2024). “Sea Level Change: Satellite Observations.” https://sealevel.nasa.gov/understanding-sea-level/global-sea-level/mean-sea-level
- Oliver, E.C.J., et al. (2018). “Longer and more frequent marine heatwaves over the past century.” Nature Communications, 9, 1324. https://www.nature.com/articles/s41467-018-03732-9
- Australian Institute of Marine Science. (2024). “2024 Coral Bleaching Event on the Great Barrier Reef.” https://www.aims.gov.au/information-centre/news-and-stories/2024-coral-bleaching-event-great-barrier-reef
- IPCC. (2021). “Climate Change 2021: The Physical Science Basis.” Cambridge University Press. https://www.ipcc.ch/report/ar6/wg1/
- Argo Program. (2024). “Argo Float Data and Metadata.” https://argo.ucsd.edu/
This article is for informational purposes only.
Reference: https://www.theguardian.com/environment/2026/sep/30/worlds-seas-warmed-23-zettajoules-2025
The post World’s oceans absorbed record heat equal to 40 times annual global energy use appeared first on Green.org.


