Ranked: Countries With the Most Years in Poor Health
See visuals like this from many other data creators on our Voronoi app. Download it for free on iOS or Android and discover incredible data-driven charts from a variety of trusted sources.
Key Takeaways
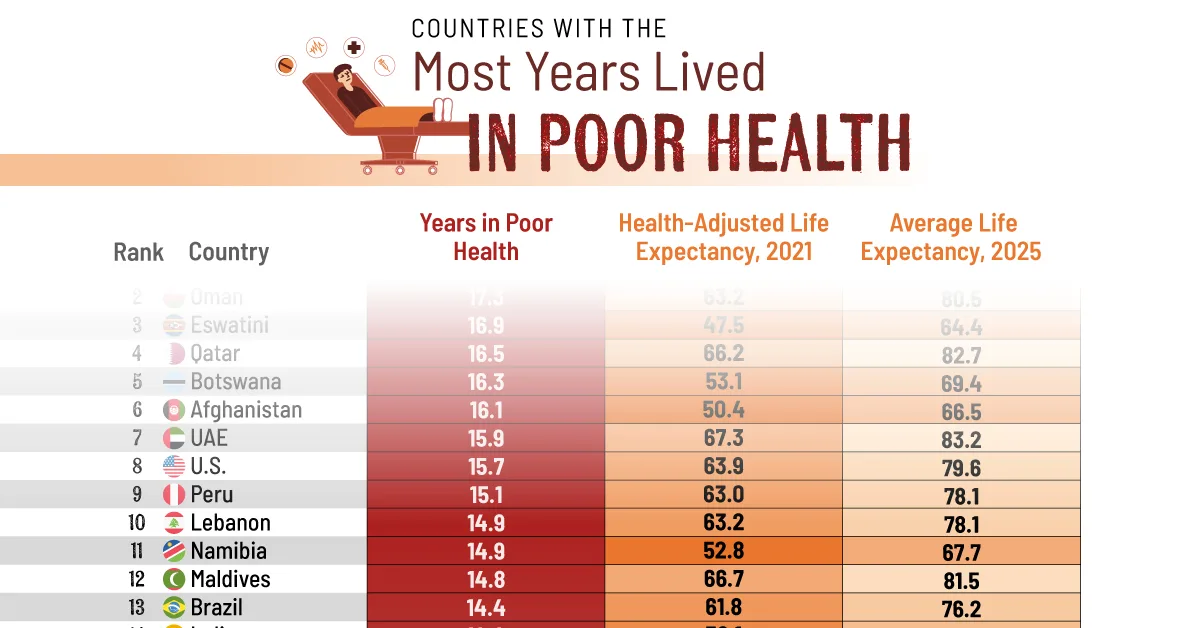
- When measuring the gap between average life expectancy and health-adjusted life expectancy (HALE), wealthy Gulf states dominate the worst performers.
- On average, residents in Bahrain, Oman, Qatar, and the UAE all spend 16–17 years in poor health.
- Another rich country, the U.S., ranks eighth by this metric, with Americans spending nearly 16 of their 80 expected years in poor health.
Many people are living longer—but not necessarily healthier—lives.
This visualization ranks countries by the number of years their citizens can expect to live in poor health, calculated as the gap between average life expectancy and health-adjusted life expectancy.
Skip to the second-last section for a full explanation of what health-adjusted life expectancy (HALE) is, and why it matters.
HALE data (for the year 2021) is sourced from the World Bank, via Our World in Data. Average life expectancy is from 2025 estimates UN World Population Prospects.
Together they reveal how disease, disability, and chronic conditions shape the quality—not just the quantity—of our lives.
 Important information:
1. Poor health is defined as having a disabling illness or injury.
2. Life expectancy figures are for both sexes, measured at birth.
3. HALE data only updates every five years and 2021 is the most recent release.
4. While the comparison isn’t perfect, shows broader regional patterns in healthcare.
5. Due to missing data some countries may not be present in this ranking.
The Difference Between Living Longer and Living Healthier
Oil wealth appears genuinely toxic to health outcomes.
Nearly every Middle Eastern petrostate (Bahrain, Oman, Qatar, UAE, Kuwait) appears in this worst-performers list.
Bahrain (17.4 years), Oman (17.3), Qatar (16.5), and the UAE (15.9) all post sizable gaps despite having robust health-care budgets.
| Rank | Country | Region | Years in Poor Health | HALE, 2021 | Average Life Expectancy, 2025 |
|---|---|---|---|---|---|
| 1 |  Bahrain Bahrain |
Asia | 17.4 | 64.2 | 81.6 |
| 2 |  Oman Oman |
Asia | 17.3 | 63.2 | 80.5 |
| 3 |  Eswatini Eswatini |
Africa | 16.9 | 47.5 | 64.4 |
| 4 |  Qatar Qatar |
Asia | 16.5 | 66.2 | 82.7 |
| 5 |  Botswana Botswana |
Africa | 16.3 | 53.1 | 69.4 |
| 6 |  Afghanistan Afghanistan |
Asia | 16.1 | 50.4 | 66.5 |
| 7 |  UAE UAE |
Asia | 15.9 | 67.3 | 83.2 |
| 8 |  U.S. U.S. |
Northern America | 15.7 | 63.9 | 79.6 |
| 9 |  Peru Peru |
Southern America | 15.1 | 63.0 | 78.1 |
| 10 |  Lebanon Lebanon |
Asia | 14.9 | 63.2 | 78.1 |
| 11 |  Namibia Namibia |
Africa | 14.9 | 52.8 | 67.7 |
| 12 |  Maldives Maldives |
Asia | 14.8 | 66.7 | 81.5 |
| 13 |  Brazil Brazil |
Southern America | 14.4 | 61.8 | 76.2 |
| 14 |  India India |
Asia | 14.4 | 58.1 | 72.5 |
| 15 |  Mozambique Mozambique |
Africa | 14.3 | 49.7 | 64.0 |
| 16 |  Iran Iran |
Asia | 14.1 | 64.0 | 78.1 |
| 17 |  North Macedonia North Macedonia |
Europe | 14.0 | 63.7 | 77.7 |
| 18 |  Mexico Mexico |
Americas | 14.0 | 61.4 | 75.4 |
| 19 |  Micronesia Micronesia |
Oceania | 13.9 | 57.9 | 71.8 |
| 20 |  Chile Chile |
Southern America | 13.8 | 67.7 | 81.5 |
| 21 |  Cuba Cuba |
Americas | 13.8 | 64.6 | 78.4 |
| 22 |  Eritrea Eritrea |
Africa | 13.8 | 55.4 | 69.2 |
| 23 |  Slovakia Slovakia |
Europe | 13.8 | 64.9 | 78.7 |
| 24 |  South Africa South Africa |
Africa | 13.7 | 52.8 | 66.5 |
| 25 |  Zambia Zambia |
Africa | 13.7 | 53.0 | 66.7 |
| 26 |  Greece Greece |
Europe | 13.6 | 68.6 | 82.2 |
| 27 |  Guatemala Guatemala |
Americas | 13.6 | 59.3 | 72.9 |
| 28 |  Bulgaria Bulgaria |
Europe | 13.6 | 62.4 | 76.0 |
| 29 |  Suriname Suriname |
Southern America | 13.6 | 60.3 | 73.9 |
| 30 |  Australia Australia |
Oceania | 13.6 | 70.6 | 84.2 |
| 31 |  Guyana Guyana |
Southern America | 13.6 | 56.8 | 70.4 |
| 32 |  Lesotho Lesotho |
Africa | 13.6 | 44.6 | 58.2 |
| 33 |  Costa Rica Costa Rica |
Americas | 13.6 | 67.6 | 81.2 |
| 34 |  Saudi Arabia Saudi Arabia |
Asia | 13.6 | 65.6 | 79.2 |
| 35 |  France France |
Europe | 13.5 | 70.1 | 83.6 |
| 36 |  Uruguay Uruguay |
Southern America | 13.5 | 65.0 | 78.5 |
| 37 |  Poland Poland |
Europe | 13.5 | 65.5 | 79.0 |
| 38 |  Ecuador Ecuador |
Southern America | 13.5 | 64.3 | 77.8 |
| 39 |  Czechia Czechia |
Europe | 13.4 | 66.7 | 80.1 |
| 40 |  Italy Italy |
Europe | 13.4 | 70.6 | 84.0 |
| 41 |  Solomon Islands Solomon Islands |
Oceania | 13.4 | 57.4 | 70.8 |
| 42 |  Bahamas Bahamas |
Americas | 13.4 | 61.5 | 74.9 |
| 43 |  Morocco Morocco |
Africa | 13.4 | 62.3 | 75.7 |
| 44 |  Ukraine Ukraine |
Europe | 13.3 | 61.6 | 74.9 |
| 45 |  Tunisia Tunisia |
Africa | 13.3 | 63.6 | 76.9 |
| 46 |  Albania Albania |
Europe | 13.3 | 66.7 | 80.0 |
| 47 |  Puerto Rico Puerto Rico |
Americas | 13.3 | 68.8 | 82.1 |
| 48 |  Panama Panama |
Americas | 13.3 | 66.7 | 80.0 |
| 49 |  Serbia Serbia |
Europe | 13.2 | 63.9 | 77.1 |
| 50 |  Paraguay Paraguay |
Southern America | 13.2 | 60.9 | 74.1 |
| 51 |  Bosnia and Herzegovina Bosnia and Herzegovina |
Europe | 13.2 | 65.0 | 78.2 |
| 52 |  Portugal Portugal |
Europe | 13.2 | 69.5 | 82.7 |
| 53 |  Honduras Honduras |
Americas | 13.2 | 60.0 | 73.2 |
| 54 |  Kazakhstan Kazakhstan |
Asia | 13.1 | 61.6 | 74.7 |
| 55 |  Yemen Yemen |
Asia | 13.1 | 56.5 | 69.6 |
| 56 |  Vanuatu Vanuatu |
Oceania | 13.1 | 58.7 | 71.8 |
| 57 |  Canada Canada |
Northern America | 13.1 | 69.8 | 82.9 |
| 58 |  Colombia Colombia |
Southern America | 13.1 | 65.0 | 78.1 |
| 59 |  Malaysia Malaysia |
Asia | 13.1 | 63.9 | 77.0 |
| 60 |  Switzerland Switzerland |
Europe | 13.1 | 71.1 | 84.2 |
| 61 |  Kiribati Kiribati |
Oceania | 13.1 | 53.6 | 66.7 |
| 62 |  Jordan Jordan |
Asia | 13.0 | 65.1 | 78.1 |
| 63 |  Malawi Malawi |
Africa | 13.0 | 54.7 | 67.7 |
| 64 |  Kuwait Kuwait |
Asia | 13.0 | 67.8 | 80.8 |
| 65 |  UK UK |
Europe | 13.0 | 68.6 | 81.6 |
The lifestyle changes that come with sudden wealth, like sedentary living, processed foods, air conditioning replacing physical activity, seem to create a specific pattern of prolonged morbidity.
The U.S. makes the top 10 as well, the only G7 economy to do. Americans are projected to spend 15.7 of 79.6 expected years in poor health.
Also worth noting is the average life expectancy at birth for all of these aforementioned countries is fairly high. Which means these countries are good at keeping people alive with advanced medical technology.
But they may be failing at keeping them healthy, as if they’ve optimized for extending life rather than living well.
Related: Qatar and the U.S. also make the list of countries with the highest obesity rates.Life Expectancies in Low-Income Countries
Several sub-Saharan African nations, including Eswatini, Botswana, and Namibia, also record gaps above 14 years.
Unlike the richer Gulf countries, they face this burden alongside much shorter life expectancies, meaning fewer total healthy years.
Latin American countries such as Peru and Brazil post similar gaps, reflecting both higher infant mortalities and higher disease burdens.
These patterns highlight a central challenge for global health: boosting not only how long people live, but how long they live well.
What is HALE (Health-Adjusted Life Expectancy)?
HALE measures how many years a person can expect to live in good health, defined as free from disabling illness or injury.
HALE matters because it fundamentally reframes what we mean by a “successful” life and healthcare system.
Traditional life expectancy tells us how long people live, but HALE tells us how long they live well.
Those “unhealthy years” are extraordinarily expensive. The U.S. healthcare system’s poor HALE performance means they’re essentially running a massive, costly life-support operation for millions of people.
Countries with better HALE ratios spend less on healthcare while achieving better outcomes because they’re preventing problems rather than managing chronic decline.
The U.S. has the highest per capita health spending amongst similar high-income countries, with the lowest average life expectancy.Learn More on the Voronoi App 
If you enjoyed today’s post, check out Highest and Lowest Life Expectancy Around the World on Voronoi, the new app from Visual Capitalist.