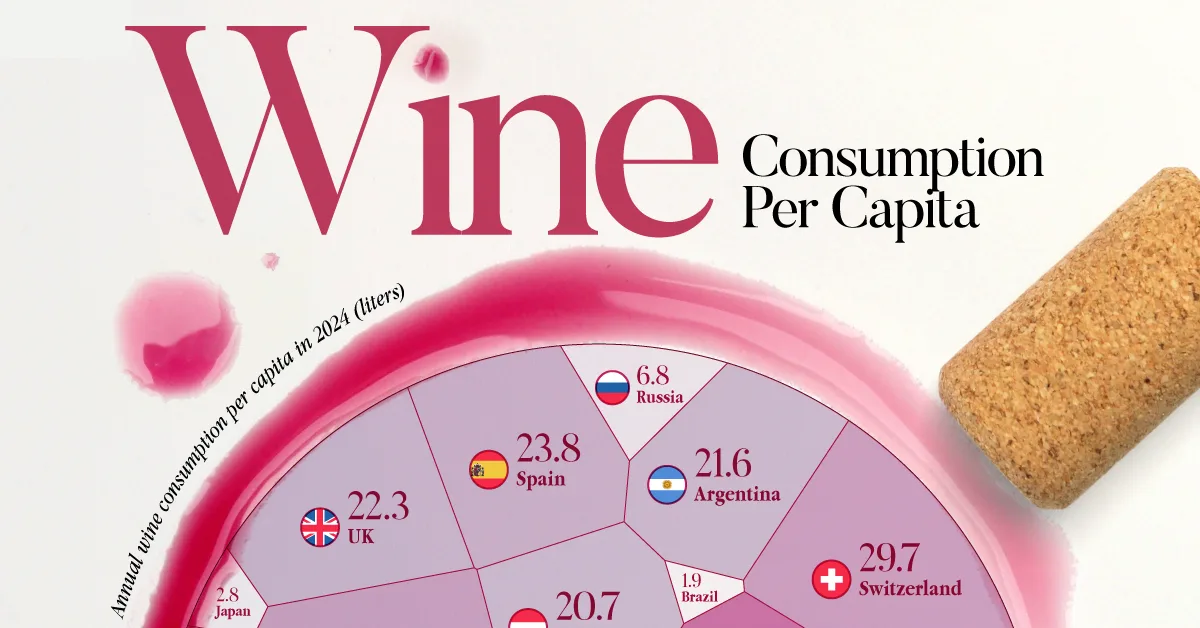
Ranked: Wine Consumption per Capita in 2024
See visuals like this from many other data creators on our Voronoi app. Download it for free on iOS or Android and discover incredible data-driven charts from a variety of trusted sources.
Key Takeaways
- Portugal tops the list at 61.1 liters per person—18.4 liters more than Italy (42.7) and nearly 3x the average (21.5).
- Europe dominates, averaging 28.7 liters per person versus 10.8 for non-European countries in this dataset, and nine of the top 10 are in Europe.
Wine is a deeply regional drink. In some countries it’s part of everyday meals, while in others it’s a more occasional purchase.
This visualization compares wine consumption per capita in 2024 across the 20 countries with the highest overall wine consumption using data from the International Organisation of Vine and Wine, and population (15 years and older) figures from the World Bank.
The differences are dramatic, showing how quickly “typical” wine consumption changes depending on where you look.
The Countries that Drink the Most Wine per Person
Portugal sits alone at the top at 61.1 liters per person in 2024. That’s 18.4 liters higher than second-place Italy (42.7) and 19.6 liters above France (41.5).
The data table below shows wine consumption per capita by country in 2024 in liters:
| Rank | Country | Annual wine consumption per capita in 2024 (liters) |
|---|---|---|
| 1 |  Portugal Portugal |
61.1 |
| 2 |  Italy Italy |
42.7 |
| 3 |  France France |
41.5 |
| 4 |  Switzerland Switzerland |
29.7 |
| 5 |  Austria Austria |
28.6 |
| 6 |  Australia Australia |
24.5 |
| 7 |  Germany Germany |
24.5 |
| 8 |  Hungary Hungary |
24.4 |
| 9 |  Spain Spain |
23.8 |
| 10 |  UK UK |
22.3 |
| 11 |  Argentina Argentina |
21.6 |
| 12 |  Netherlands Netherlands |
20.7 |
| 13 |  Romania Romania |
18.7 |
| 14 |  Canada Canada |
13.7 |
| 15 |  USA USA |
11.8 |
| 16 |  South Africa South Africa |
9.2 |
| 17 |  Russia Russia |
6.8 |
| 18 |  Japan Japan |
2.8 |
| 19 |  Brazil Brazil |
1.9 |
| 20 |  China China |
0.5 |
Portugal’s high wine production per capita and low value-added tax (VAT) of 13% on still wine (the lowest in the EU) fuel its high consumption.
Even if sparkling wines face a 23% value-added tax in Portugal (with no extra alcohol excise tax), in-restaurant sparkling VAT falls back down to 13%.
Across the 20 countries shown, the average is 21.5 liters per person and the median is 22.0—meaning half of countries are above (or below) roughly the low-20s.
European Countries Drink the Most Wine per Capita
European countries hold the top five spots in terms of drinking the most wine per capita, and as a group, European countries average 28.7 liters per person, well above the 20-country average of 21.5.
However, there’s a clear top tier even among European countries, with a significant drop-off after the top three.
Consumption falls 11.8 liters from France (41.5) to Switzerland (29.7)—equal to the entire per-capita consumption level in the U.S. (11.8).
Wine Consumption Varies Outside Europe
Non-European countries in this dataset average 10.8 liters per person—less than half the European average (28.7). But the spread is wide.
Australia is the standout at 24.5 liters, while Canada (13.7) and the U.S. (11.8) sit closer to the middle-lower range.
At the bottom end, Japan (2.8), Brazil (1.9), and China (0.5) show how small per-capita consumption can be in large, non-traditional markets.
Learn More on the Voronoi App 
To learn more about global wine consumption, check out this graphic on Voronoi which visualizes overall consumption per country.