Mapped: Countries by Total Fertility Rate
See visuals like this from many other data creators on our Voronoi app. Download it for free on iOS or Android and discover incredible data-driven charts from a variety of trusted sources.
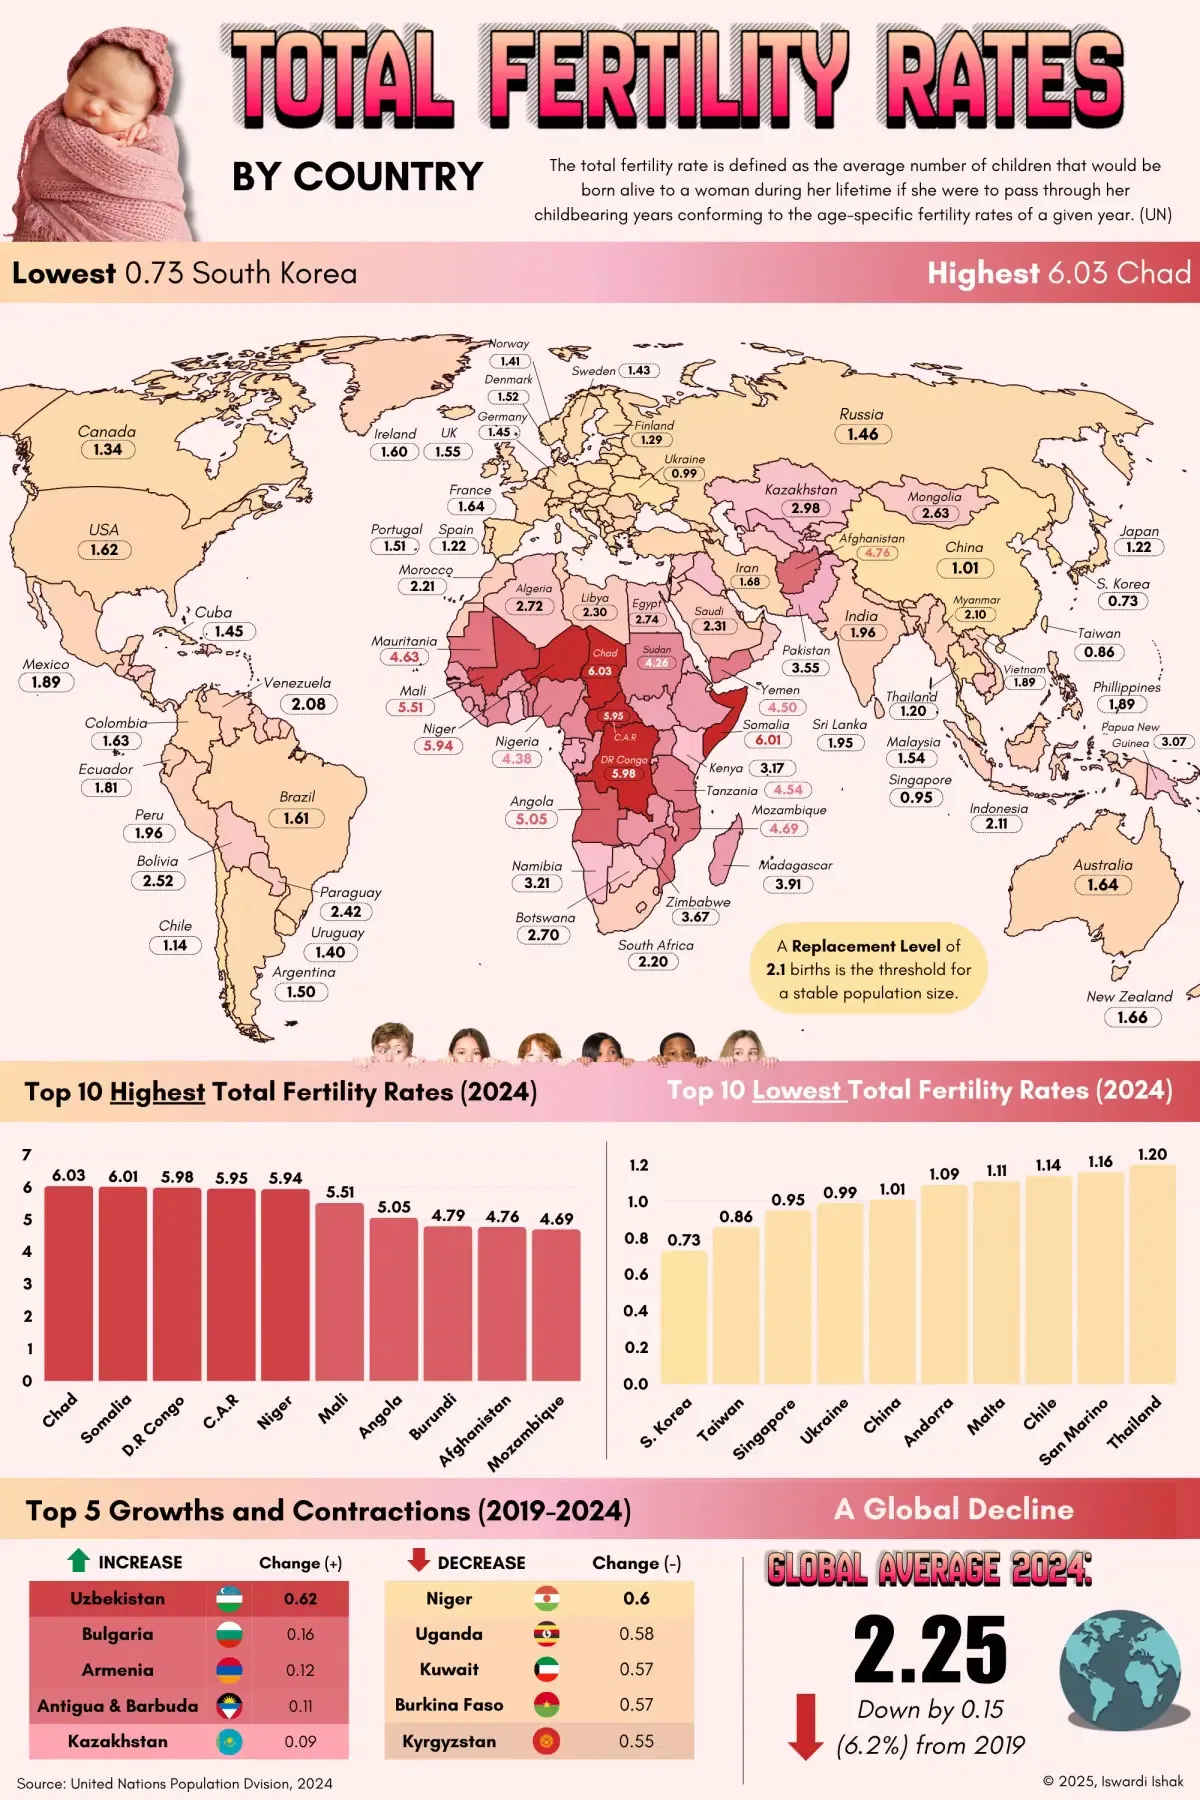
- Fertility rates are falling almost universally; however, there are a handful of outliers that have seen rates increase slightly in the last five years.
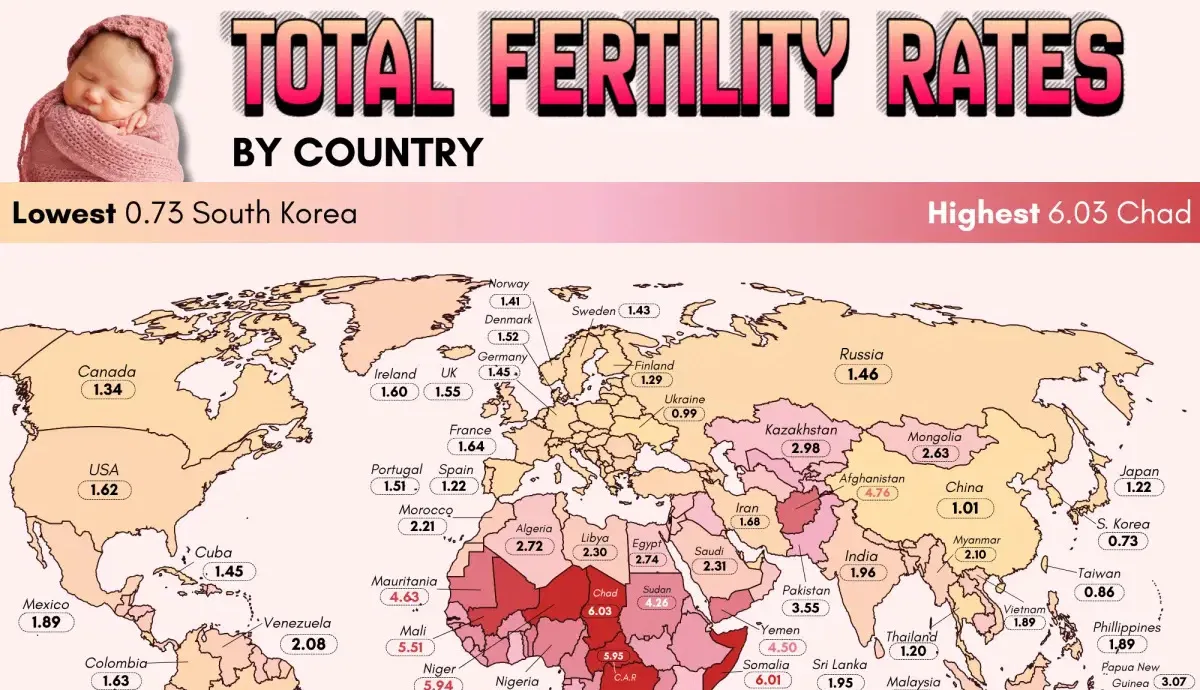
- As a general rule: Africa has the highest fertility, and parts of East Asia see some of the lowest birth rates.
- Developed countries are almost all below replacement level (2.1 births per woman), with one notable exception: Israel.
Fertility rates are dropping across the world.
Between 2019 and 2024, there were only 12 countries that saw fertility rates grow—meanwhile rates declined or stayed the same in 185 countries.
This map visualization by Idwardi Ishak uses data from the United Nations to show the total fertility rate for countries and other notable jurisdictions globally.
 Total fertility rate is defined as the average number of children that would be born alive to a woman during her lifetime if she were to pass through her childbearing years conforming to the age-specific fertility rates of a given year.
Total Fertility Rate Data by Country
The below table shows the total fertility rate for each jurisdiction using data from 2019 and 2024, while also highlighting the five-year change between the years.
| Rank | Country | Total Fertility Rate (2024) | TFR (2019) | 5-Yr Change |
|---|---|---|---|---|
| 1 |  Chad Chad |
6.03 | 6.41 | -0.38 |
| 2 |  Somalia Somalia |
6.01 | 6.56 | -0.55 |
| 3 |  DR Congo DR Congo |
5.98 | 6.25 | -0.27 |
| 4 |  Central African Republic Central African Republic |
5.95 | 6.09 | -0.14 |
| 5 |  Niger Niger |
5.94 | 6.54 | -0.60 |
| 6 |  Mali Mali |
5.51 | 5.89 | -0.38 |
| 7 |  Angola Angola |
5.05 | 5.44 | -0.40 |
| 8 |  Burundi Burundi |
4.79 | 5.27 | -0.48 |
| 9 |  Afghanistan Afghanistan |
4.76 | 5.24 | -0.48 |
| 10 |  Mozambique Mozambique |
4.69 | 5.02 | -0.33 |
| 11 |  Mauritania Mauritania |
4.63 | 4.98 | -0.36 |
| 12 |  Mayotte Mayotte |
4.56 | 4.58 | -0.02 |
| 13 |  Tanzania Tanzania |
4.54 | 4.87 | -0.33 |
| 14 |  Yemen Yemen |
4.50 | 4.60 | -0.10 |
| 15 |  Benin Benin |
4.48 | 4.90 | -0.42 |
| 16 |  Nigeria Nigeria |
4.38 | 4.86 | -0.48 |
| 17 |  Sudan Sudan |
4.26 | 4.62 | -0.35 |
| 18 |  Cameroon Cameroon |
4.26 | 4.65 | -0.39 |
| 19 |  Côte d’Ivoire Côte d’Ivoire |
4.23 | 4.52 | -0.29 |
| 20 |  Uganda Uganda |
4.17 | 4.74 | -0.58 |
| 21 |  Guinea Guinea |
4.13 | 4.58 | -0.45 |
| 22 |  Togo Togo |
4.12 | 4.45 | -0.33 |
| 23 |  Equatorial Guinea Equatorial Guinea |
4.12 | 4.43 | -0.31 |
| 24 |  Burkina Faso Burkina Faso |
4.11 | 4.68 | -0.57 |
| 25 |  Republic of the Congo Republic of the Congo |
4.11 | 4.38 | -0.27 |
| 26 |  Zambia Zambia |
4.04 | 4.42 | -0.38 |
| 27 |  Madagascar Madagascar |
3.91 | 4.22 | -0.31 |
| 28 |  Ethiopia Ethiopia |
3.91 | 4.35 | -0.44 |
| 29 |  Gambia Gambia |
3.91 | 4.33 | -0.42 |
| 30 |  Liberia Liberia |
3.86 | 4.26 | -0.39 |
| 31 |  Comoros Comoros |
3.82 | 4.14 | -0.32 |
| 32 |  Samoa Samoa |
3.80 | 4.06 | -0.26 |
| 33 |  South Sudan South Sudan |
3.79 | 4.26 | -0.48 |
| 34 |  Senegal Senegal |
3.77 | 4.10 | -0.34 |
| 35 |  Guinea-Bissau Guinea-Bissau |
3.76 | 4.15 | -0.40 |
| 36 |  Sierra Leone Sierra Leone |
3.70 | 4.19 | -0.49 |
| 37 |  Eritrea Eritrea |
3.68 | 4.00 | -0.32 |
| 38 |  Zimbabwe Zimbabwe |
3.67 | 3.75 | -0.07 |
| 39 |  Rwanda Rwanda |
3.65 | 3.99 | -0.34 |
| 40 |  São Tomé & Príncipe São Tomé & Príncipe |
3.60 | 3.90 | -0.30 |
| 41 |  Gabon Gabon |
3.59 | 3.88 | -0.29 |
| 42 |  Malawi Malawi |
3.59 | 3.95 | -0.36 |
| 43 |  Vanuatu Vanuatu |
3.57 | 3.79 | -0.22 |
| 44 |  Pakistan Pakistan |
3.55 | 3.81 | -0.26 |
| 45 |  Solomon Islands Solomon Islands |
3.51 | 3.80 | -0.29 |
| 46 |  Uzbekistan Uzbekistan |
3.49 | 2.87 | 0.62 |
| 47 |  Ghana Ghana |
3.34 | 3.59 | -0.25 |
| 48 |  French Guiana French Guiana |
3.34 | 3.73 | -0.39 |
| 49 |  Nauru Nauru |
3.29 | 3.53 | -0.24 |
| 50 |  Palestine Palestine |
3.25 | 3.59 | -0.34 |
| 51 |  Iraq Iraq |
3.22 | 3.48 | -0.26 |
| 52 |  Namibia Namibia |
3.21 | 3.40 | -0.19 |
| 53 |  Tuvalu Tuvalu |
3.17 | 3.33 | -0.16 |
| 54 |  Kenya Kenya |
3.17 | 3.43 | -0.27 |
| 55 |  Kiribati Kiribati |
3.12 | 3.29 | -0.17 |
| 56 |  Tonga Tonga |
3.10 | 3.27 | -0.17 |
| 57 |  Papua New Guinea Papua New Guinea |
3.07 | 3.32 | -0.25 |
| 58 |  Tajikistan Tajikistan |
3.04 | 3.28 | -0.25 |
| 59 |  Kazakhstan Kazakhstan |
2.98 | 2.89 | 0.09 |
| 60 |  Marshall Islands Marshall Islands |
2.86 | 3.01 | -0.15 |
| 61 |  Micronesia Micronesia |
2.83 | 2.98 | -0.15 |
| 62 |  Israel Israel |
2.79 | 3.03 | -0.25 |
| 63 |  Kyrgyzstan Kyrgyzstan |
2.78 | 3.33 | -0.55 |
| 64 |  Guam Guam |
2.75 | 2.94 | -0.19 |
| 65 |  Egypt Egypt |
2.74 | 2.87 | -0.14 |
| 66 |  Algeria Algeria |
2.72 | 3.00 | -0.28 |
| 67 |  Eswatini Eswatini |
2.72 | 2.93 | -0.21 |
| 68 |  Botswana Botswana |
2.70 | 2.91 | -0.20 |
| 69 |  Syria Syria |
2.70 | 2.88 | -0.18 |
| 70 |  Lesotho Lesotho |
2.66 | 2.92 | -0.26 |
| 71 |  Turkmenistan Turkmenistan |
2.66 | 2.83 | -0.17 |
| 72 |  Mongolia Mongolia |
2.63 | 3.01 | -0.38 |
| 73 |  Timor-Leste Timor-Leste |
2.63 | 3.12 | -0.49 |
| 74 |  Haiti Haiti |
2.63 | 2.86 | -0.24 |
| 75 |  Djibouti Djibouti |
2.62 | 2.80 | -0.18 |
| 76 |  Jordan Jordan |
2.60 | 2.86 | -0.25 |
| 77 |  Cambodia Cambodia |
2.55 | 2.73 | -0.18 |
| 78 |  Bolivia Bolivia |
2.52 | 2.69 | -0.17 |
| 79 |  Oman Oman |
2.51 | 2.70 | -0.19 |
| 80 |  Honduras Honduras |
2.48 | 2.61 | -0.14 |
| 81 |  Paraguay Paraguay |
2.42 | 2.53 | -0.11 |
| 82 |  Laos Laos |
2.40 | 2.59 | -0.19 |
| 83 |  Guyana Guyana |
2.40 | 2.52 | -0.13 |
| 84 |  Saudi Arabia Saudi Arabia |
2.31 | 2.49 | -0.18 |
| 85 |  Libya Libya |
2.30 | 2.54 | -0.24 |
| 86 |  Guatemala Guatemala |
2.29 | 2.59 | -0.31 |
| 87 |  Fiji Fiji |
2.27 | 2.39 | -0.12 |
| 88 |  American Samoa American Samoa |
2.27 | 2.40 | -0.14 |
| 89 |  Suriname Suriname |
2.23 | 2.35 | -0.12 |
| 90 |  Lebanon Lebanon |
2.23 | 2.33 | -0.10 |
| 91 |  Faroe Islands Faroe Islands |
2.22 | 2.40 | -0.18 |
| 92 |  Dominican Republic Dominican Republic |
2.22 | 2.37 | -0.14 |
| 93 |  Morocco Morocco |
2.21 | 2.34 | -0.13 |
| 94 |  Nicaragua Nicaragua |
2.21 | 2.32 | -0.12 |
| 95 |  South Africa South Africa |
2.21 | 2.26 | -0.06 |
| 96 |  Western Sahara Western Sahara |
2.18 | 2.28 | -0.10 |
| 97 |  Réunion Réunion |
2.15 | 2.13 | 0.02 |
| 98 |  Bangladesh Bangladesh |
2.14 | 2.18 | -0.04 |
| 99 |  Indonesia Indonesia |
2.12 | 2.21 | -0.09 |
| 100 |  Seychelles Seychelles |
2.11 | 2.26 | -0.15 |
| 101 |  Panama Panama |
2.11 | 2.29 | -0.18 |
| 102 |  Monaco Monaco |
2.10 | 2.40 | -0.30 |
| 103 |  Myanmar Myanmar |
2.10 | 2.21 | -0.11 |
| 104 |  U.S. Virgin Islands U.S. Virgin Islands |
2.08 | 2.16 | -0.08 |
| 105 |  Venezuela Venezuela |
2.08 | 2.13 | -0.05 |
| 106 |  Belize Belize |
2.02 | 2.14 | -0.12 |
| 107 |  Peru Peru |
1.97 | 2.09 | -0.12 |
| 108 |  India India |
1.96 | 2.12 | -0.16 |
| 109 |  Nepal Nepal |
1.96 | 2.08 | -0.12 |
| 110 |  Sri Lanka Sri Lanka |
1.95 | 2.02 | -0.07 |
| 111 |  Greenland Greenland |
1.93 | 2.01 | -0.08 |
| 112 |  Vietnam Vietnam |
1.90 | 1.94 | -0.05 |
| 113 |  Philippines Philippines |
1.89 | 2.22 | -0.32 |
| 114 |  Mexico Mexico |
1.89 | 2.02 | -0.13 |
| 115 |  Palau Palau |
1.88 | 1.98 | -0.10 |
| 116 |  Tunisia Tunisia |
1.82 | 2.10 | -0.28 |
| 117 |  Ecuador Ecuador |
1.81 | 2.04 | -0.23 |
| 118 |  Bahrain Bahrain |
1.81 | 1.84 | -0.04 |
| 119 |  Georgia Georgia |
1.80 | 2.02 | -0.22 |
| 120 |  Montenegro Montenegro |
1.80 | 1.81 | -0.02 |
| 121 |  North Korea North Korea |
1.78 | 1.83 | -0.04 |
| 122 |  El Salvador El Salvador |
1.77 | 1.84 | -0.07 |
| 123 |  Bulgaria Bulgaria |
1.75 | 1.58 | 0.17 |
| 124 |  Brunei Brunei |
1.73 | 1.82 | -0.09 |
| 125 |  Moldova Moldova |
1.73 | 1.78 | -0.05 |
| 126 |  Qatar Qatar |
1.72 | 1.73 | -0.01 |
| 127 |  Armenia Armenia |
1.72 | 1.60 | 0.12 |
| 128 |  Romania Romania |
1.71 | 1.71 | 0.00 |
| 129 |  Barbados Barbados |
1.71 | 1.72 | -0.01 |
| 130 |  Iran Iran |
1.68 | 1.77 | -0.08 |
| 131 |  New Zealand New Zealand |
1.66 | 1.72 | -0.06 |
| 132 |  Australia Australia |
1.64 | 1.67 | -0.03 |
| 133 |  France France |
1.64 | 1.83 | -0.19 |
| 134 |  Colombia Colombia |
1.63 | 1.71 | -0.08 |
| 135 |  United States United States |
1.62 | 1.68 | -0.06 |
| 136 |  Turkey Turkey |
1.62 | 1.89 | -0.27 |
| 137 |  Brazil Brazil |
1.61 | 1.71 | -0.09 |
| 138 |  Ireland Ireland |
1.60 | 1.72 | -0.12 |
| 139 |  Slovenia Slovenia |
1.58 | 1.61 | -0.04 |
| 140 |  Slovakia Slovakia |
1.56 | 1.57 | -0.00 |
| 141 |  Maldives Maldives |
1.56 | 1.64 | -0.08 |
| 142 |  United Kingdom United Kingdom |
1.55 | 1.63 | -0.08 |
| 143 |  Malaysia Malaysia |
1.54 | 1.78 | -0.23 |
| 144 |  Liechtenstein Liechtenstein |
1.54 | 1.48 | 0.05 |
| 145 |  Trinidad & Tobago Trinidad & Tobago |
1.54 | 1.58 | -0.04 |
| 146 |  Denmark Denmark |
1.52 | 1.70 | -0.18 |
| 147 |  Kuwait Kuwait |
1.52 | 2.09 | -0.57 |
| 148 |  Portugal Portugal |
1.51 | 1.42 | 0.09 |
| 149 |  Argentina Argentina |
1.50 | 1.88 | -0.38 |
| 150 |  Serbia Serbia |
1.50 | 1.51 | -0.01 |
| 151 |  Bosnia & Herzegovina Bosnia & Herzegovina |
1.49 | 1.51 | -0.02 |
| 152 |  Hungary Hungary |
1.49 | 1.53 | -0.04 |
| 153 |  Croatia Croatia |
1.47 | 1.47 | 0.00 |
| 154 |  North Macedonia North Macedonia |
1.47 | 1.65 | -0.18 |
| 155 |  Russia Russia |
1.46 | 1.50 | -0.05 |
| 156 |  Czechia Czechia |
1.46 | 1.75 | -0.30 |
| 157 |  Bhutan Bhutan |
1.45 | 1.45 | 0.00 |
| 158 |  Germany Germany |
1.45 | 1.54 | -0.09 |
| 159 |  Cuba Cuba |
1.45 | 1.54 | -0.10 |
| 160 |  Switzerland Switzerland |
1.44 | 1.48 | -0.04 |
| 161 |  Netherlands Netherlands |
1.43 | 1.57 | -0.14 |
| 162 |  Sweden Sweden |
1.43 | 1.71 | -0.28 |
| 163 |  Norway Norway |
1.41 | 1.53 | -0.12 |
| 164 |  Luxembourg Luxembourg |
1.40 | 1.34 | 0.06 |
| 165 |  Uruguay Uruguay |
1.40 | 1.57 | -0.17 |
| 166 |  Belgium Belgium |
1.38 | 1.61 | -0.23 |
| 167 |  Cyprus Cyprus |
1.38 | 1.33 | 0.05 |
| 168 |  Estonia Estonia |
1.36 | 1.66 | -0.30 |
| 169 |  Jamaica Jamaica |
1.35 | 1.39 | -0.04 |
| 170 |  Canada Canada |
1.34 | 1.48 | -0.13 |
| 171 |  Latvia Latvia |
1.34 | 1.61 | -0.27 |
| 172 |  Albania Albania |
1.34 | 1.40 | -0.06 |
| 173 |  Greece Greece |
1.34 | 1.34 | -0.00 |
| 174 |  Austria Austria |
1.32 | 1.46 | -0.14 |
| 175 |  Costa Rica Costa Rica |
1.32 | 1.60 | -0.28 |
| 176 |  Poland Poland |
1.30 | 1.44 | -0.13 |
| 177 |  Finland Finland |
1.29 | 1.35 | -0.06 |
| 178 |  Mauritius Mauritius |
1.23 | 1.35 | -0.13 |
| 179 |  Spain Spain |
1.22 | 1.23 | -0.01 |
| 180 |  Belarus Belarus |
1.22 | 1.39 | -0.17 |
| 181 |  Japan Japan |
1.22 | 1.32 | -0.11 |
| 182 |  United Arab Emirates United Arab Emirates |
1.21 | 1.25 | -0.03 |
| 183 |  Lithuania Lithuania |
1.21 | 1.61 | -0.40 |
| 184 |  Italy Italy |
1.21 | 1.26 | -0.05 |
| 185 |  Thailand Thailand |
1.20 | 1.29 | -0.08 |
| 186 |  San Marino San Marino |
1.16 | 1.10 | 0.06 |
| 187 |  Chile Chile |
1.14 | 1.43 | -0.29 |
| 188 |  Malta Malta |
1.11 | 1.15 | -0.04 |
| 189 |  Andorra Andorra |
1.09 | 1.05 | 0.04 |
| 190 |  China China |
1.01 | 1.50 | -0.48 |
| 191 |  Ukraine Ukraine |
0.99 | 1.22 | -0.23 |
| 192 |  Singapore Singapore |
0.95 | 0.94 | 0.01 |
| 193 |  Puerto Rico Puerto Rico |
0.94 | 0.98 | -0.04 |
| 194 |  Taiwan Taiwan |
0.86 | 1.05 | -0.18 |
| 195 |  South Korea South Korea |
0.73 | 0.88 | -0.15 |
| 196 |  Hong Kong (SAR) Hong Kong (SAR) |
0.73 | 1.06 | -0.33 |
| 197 |  Macau (SAR) Macau (SAR) |
0.68 | 0.94 | -0.26 |
| — |  Global Average Global Average |
2.25 | 2.40 | -0.15 |
The eight highest ranking countries in terms of fertility are all found in Africa, with the top three being Chad (6.03), Somalia (6.01), and the DRC (5.98). Even so, these countries have seen meaningful five-year drops in their rates, averaging around a 0.4 decrease in births per woman.
At the bottom of the rankings, we have four Asian jurisdictions: Taiwan (0.86), South Korea (0.73), Hong Kong (0.73), and Macau (0.68).
Where Fertility is Falling the Fastest
Fertility is falling fastest in a mix of very different regions, highlighting how universal the shift has become.
Some of the sharpest declines since 2019 are in Africa, including Niger and Uganda, where fertility remains high but is dropping rapidly as urbanization and education expand.
East Asia continues to see steep declines from already low levels, with China, South Korea, Hong Kong, and Macau pushing deeper into ultra-low fertility. Meanwhile, parts of the Middle East (such as Kuwait) and Eastern Europe (including Lithuania) have also seen rapid drops, driven by economic pressure, delayed family formation, and migration.
The Developed World: One Big Outlier
In the developed countries, almost all places are now well below the replacement rate threshold.
That said, Israel remains as the one big outlier. In 2024, the country had a fertility rate of 2.79 children per woman.
This is largely because having children is strongly supported both culturally and institutionally in Israel, across income and education levels. Further, high fertility is reinforced by generous family policies, widespread childcare support, and strong social norms, including large families among religious communities.
Learn More on the Voronoi App 
What is the population growth forecast for the United States going forward? Find out in this visualization that shows both birth rates and net immigration.