 See more visualizations like this on the Voronoi app.
Charted: Declining Fertility Rates in OECD Countries (1950-2025)
See visuals like this from many other data creators on our Voronoi app. Download it for free on iOS or Android and discover incredible data-driven charts from a variety of trusted sources.
Key Takeaways
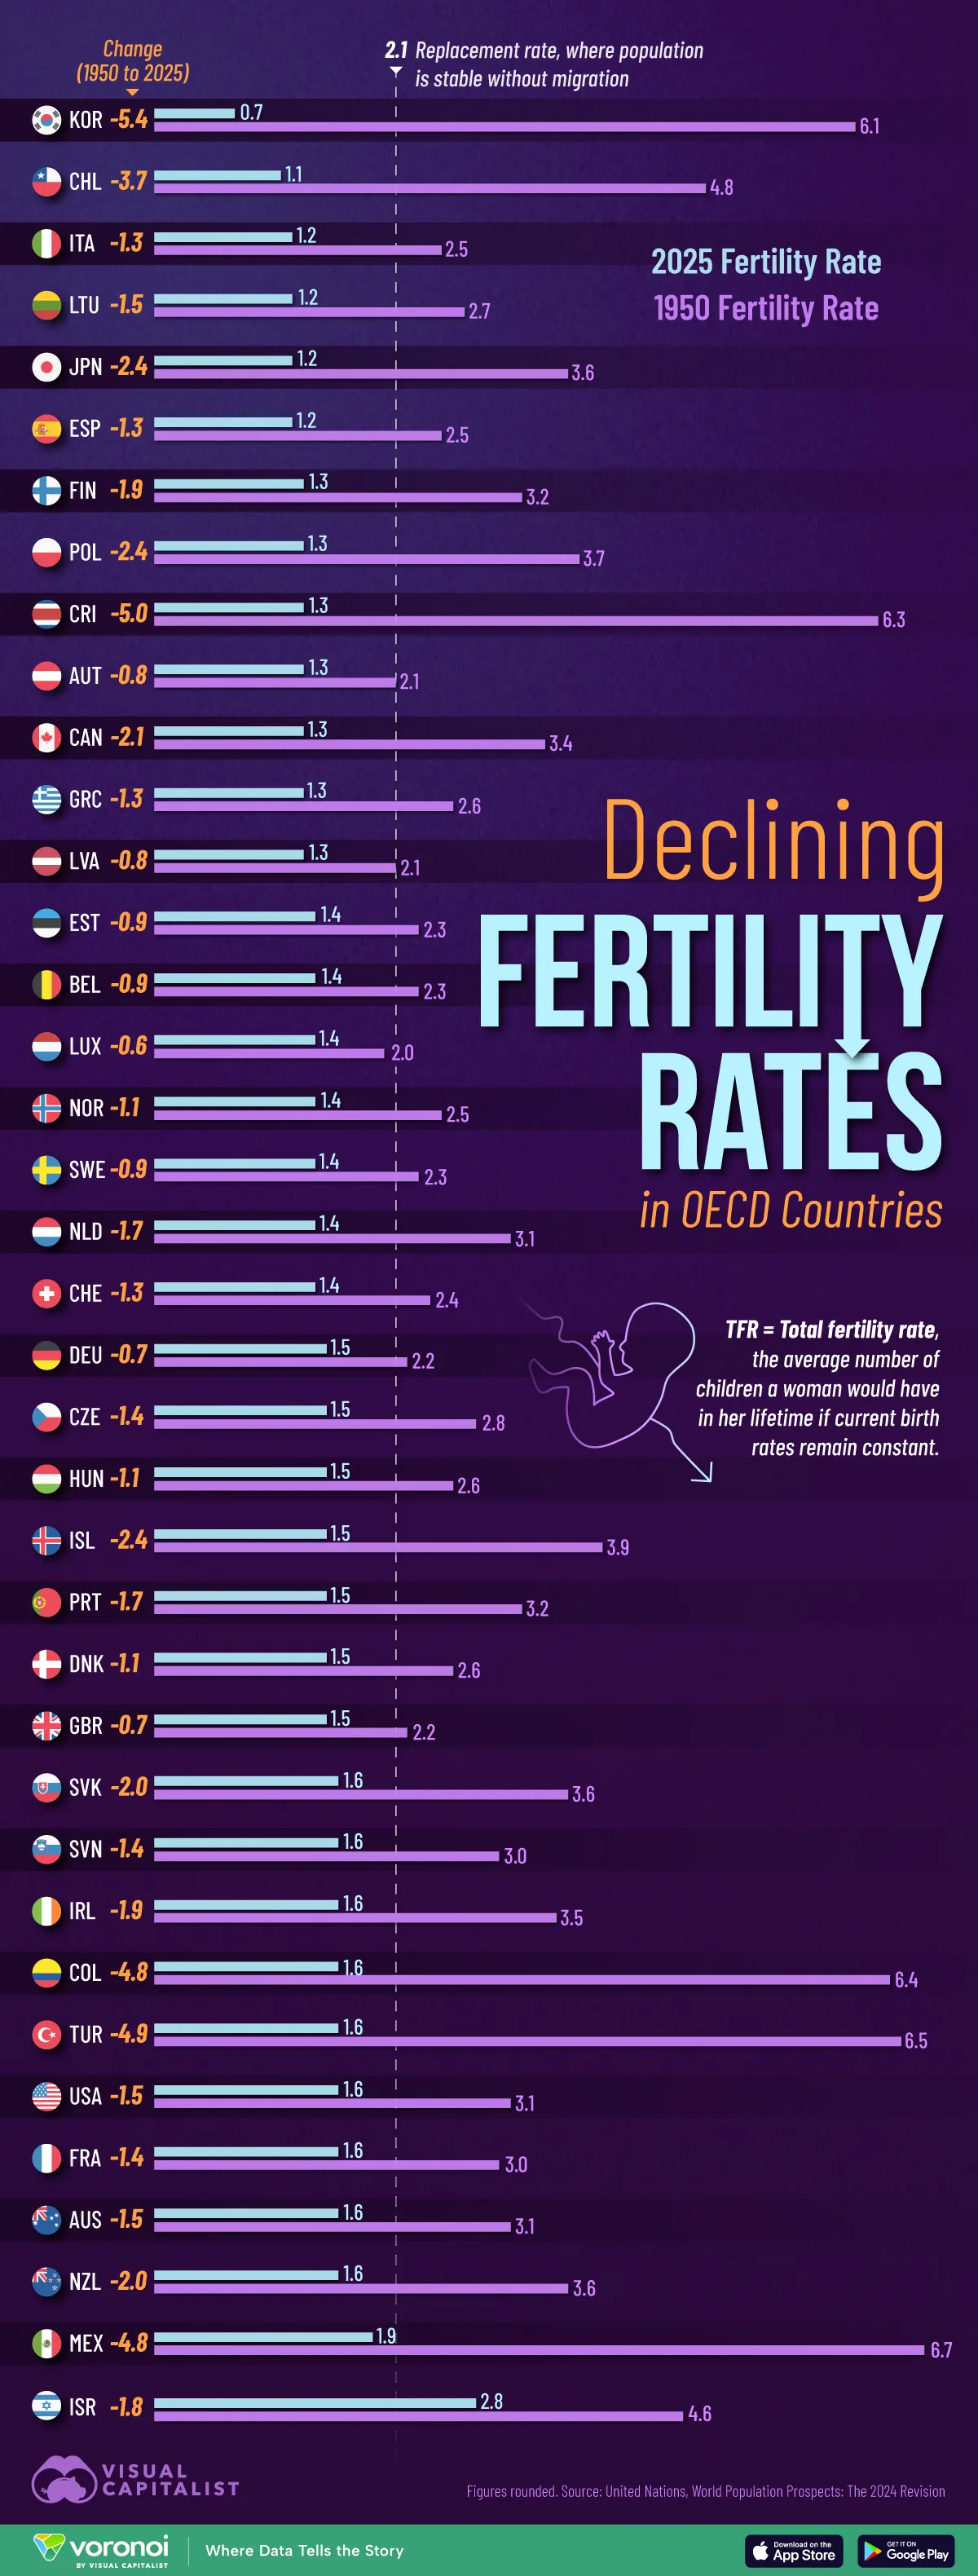
- Across 37 out of 38 OECD countries, fertility rates are below the 2.1 replacement level needed to sustain a population’s size.
- While South Korea and Chile have the lowest fertility rates across the group, Israel and Mexico have the highest.
Fertility rates are collapsing faster than expected around the world.
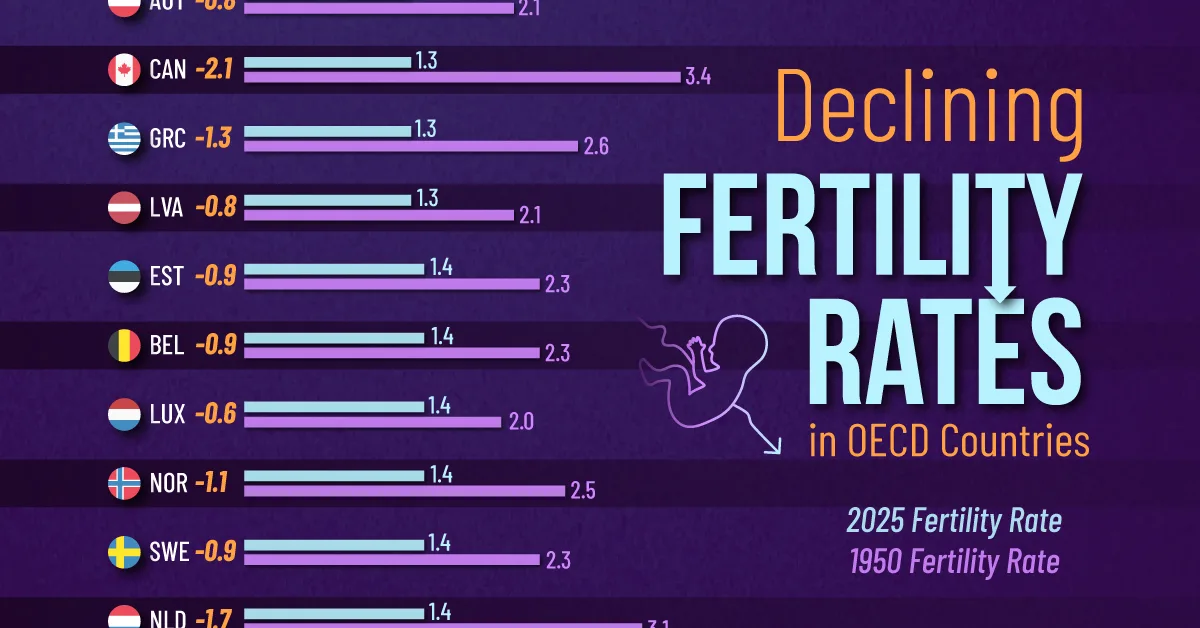
In Mexico, years of declining fertility rates have pushed average births per woman to 1.9, down from 6.7 in 1950. Moreover, fertility rates in Costa Rica are lower than the U.S., standing at 1.3 births per woman.
This graphic shows total fertility rates in OECD countries compared to 1950, based on data from the United Nation’s World Population Prospects: The 2024 Revision.
A Closer Look at Declining Fertility Rates
Below, we show the total fertility rates of countries, which represents the average number of children a woman would have in her lifetime if current birth rates remain constant.
| Country | Total Fertility Rate 1950 |
Total Fertility Rate 2025 |
Change 1950 to 2025 |
|---|---|---|---|
 South Korea South Korea |
6.1 | 0.7 | -5.4 |
 Chile Chile |
4.8 | 1.1 | -3.7 |
 Italy Italy |
2.5 | 1.2 | -1.3 |
 Lithuania Lithuania |
2.7 | 1.2 | -1.5 |
 Japan Japan |
3.6 | 1.2 | -2.4 |
 Spain Spain |
2.5 | 1.2 | -1.3 |
 Finland Finland |
3.2 | 1.3 | -1.9 |
 Poland Poland |
3.7 | 1.3 | -2.4 |
 Costa Rica Costa Rica |
6.3 | 1.3 | -5.0 |
 Austria Austria |
2.1 | 1.3 | -0.8 |
 Canada Canada |
3.4 | 1.3 | -2.1 |
 Greece Greece |
2.6 | 1.3 | -1.3 |
 Latvia Latvia |
2.1 | 1.3 | -0.8 |
 Estonia Estonia |
2.3 | 1.4 | -0.9 |
 Belgium Belgium |
2.3 | 1.4 | -0.9 |
 Luxembourg Luxembourg |
2.0 | 1.4 | -0.6 |
 Norway Norway |
2.5 | 1.4 | -1.1 |
 Sweden Sweden |
2.3 | 1.4 | -0.9 |
 Netherlands Netherlands |
3.1 | 1.4 | -1.7 |
 Switzerland Switzerland |
2.4 | 1.4 | -1.0 |
 Germany Germany |
2.2 | 1.5 | -0.7 |
 Czechia Czechia |
2.8 | 1.5 | -1.3 |
 Hungary Hungary |
2.6 | 1.5 | -1.1 |
 Iceland Iceland |
3.9 | 1.5 | -2.4 |
 Portugal Portugal |
3.2 | 1.5 | -1.7 |
 Denmark Denmark |
2.6 | 1.5 | -1.1 |
 United Kingdom United Kingdom |
2.2 | 1.5 | -0.7 |
 Slovakia Slovakia |
3.6 | 1.6 | -2.0 |
 Slovenia Slovenia |
3.0 | 1.6 | -1.4 |
 Ireland Ireland |
3.5 | 1.6 | -1.9 |
 Colombia Colombia |
6.4 | 1.6 | -4.8 |
 Türkiye Türkiye |
6.5 | 1.6 | -4.9 |
 United States United States |
3.1 | 1.6 | -1.5 |
 France France |
3.0 | 1.6 | -1.4 |
 Australia Australia |
3.1 | 1.6 | -1.5 |
 New Zealand New Zealand |
3.6 | 1.6 | -2.0 |
 Mexico Mexico |
6.7 | 1.9 | -4.8 |
 Israel Israel |
4.6 | 2.8 | -1.8 |
South Korea’s average fertility rate has plummeted from 6.1 births per woman in 1950 to 0.7 today, one of the fastest declines globally.
Fertility rates in the country fell below the replacement level more than 40 years ago and have steadily declined since. Among the factors driving down birth rates are high childbearing costs, workplace barriers, and a rigid work culture.
As we can see, Chile has the second-lowest total fertility rate in the OECD, at 1.1 births per woman, falling below Japan. In 1950, the total fertility rate was 4.8—higher than the majority of OECD countries.
Meanwhile, Italy faces the lowest fertility rate among European countries, at 1.2 births per woman, and France has the highest at 1.6.
Similarly, the U.S. sits on the higher end of the pack, with 1.6 births per woman, even as fertility rates hit record lows. Overall, only two OECD countries—Mexico and Israel—have higher fertility rates.
Learn More on the Voronoi App
To learn more about this topic, check out this graphic on falling fertility rates of the world’s 10 biggest countries.