Mapped: AI Adoption Rates by Country
See visuals like this from many other data creators on our Voronoi app. Download it for free on iOS or Android and discover incredible data-driven charts from a variety of trusted sources.
Key Takeaways
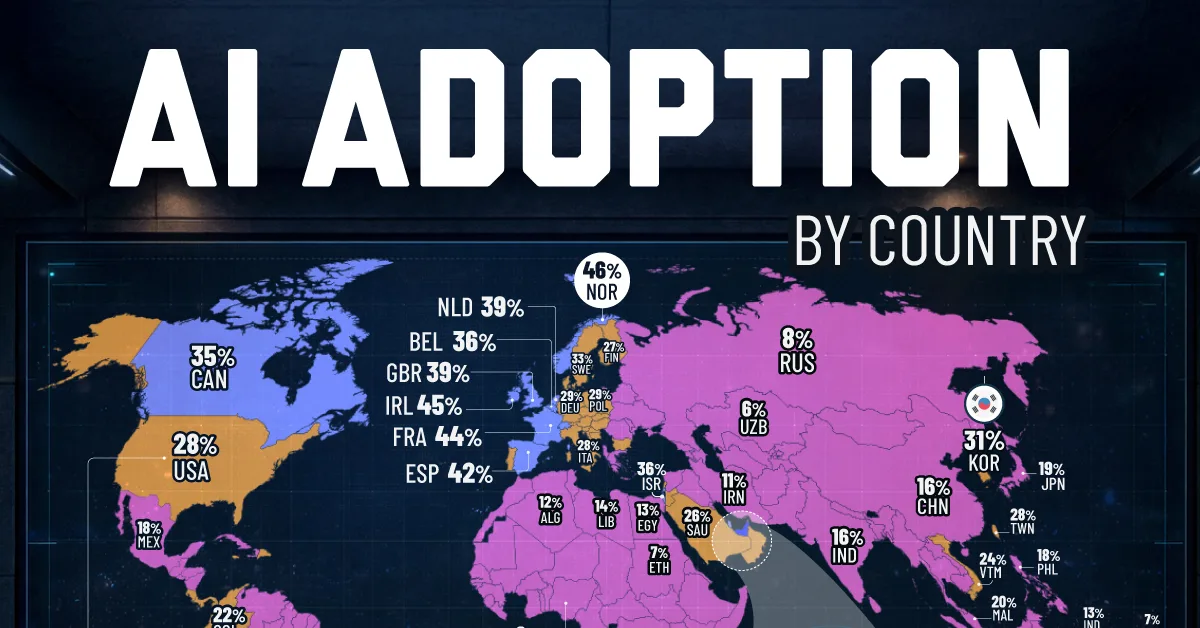
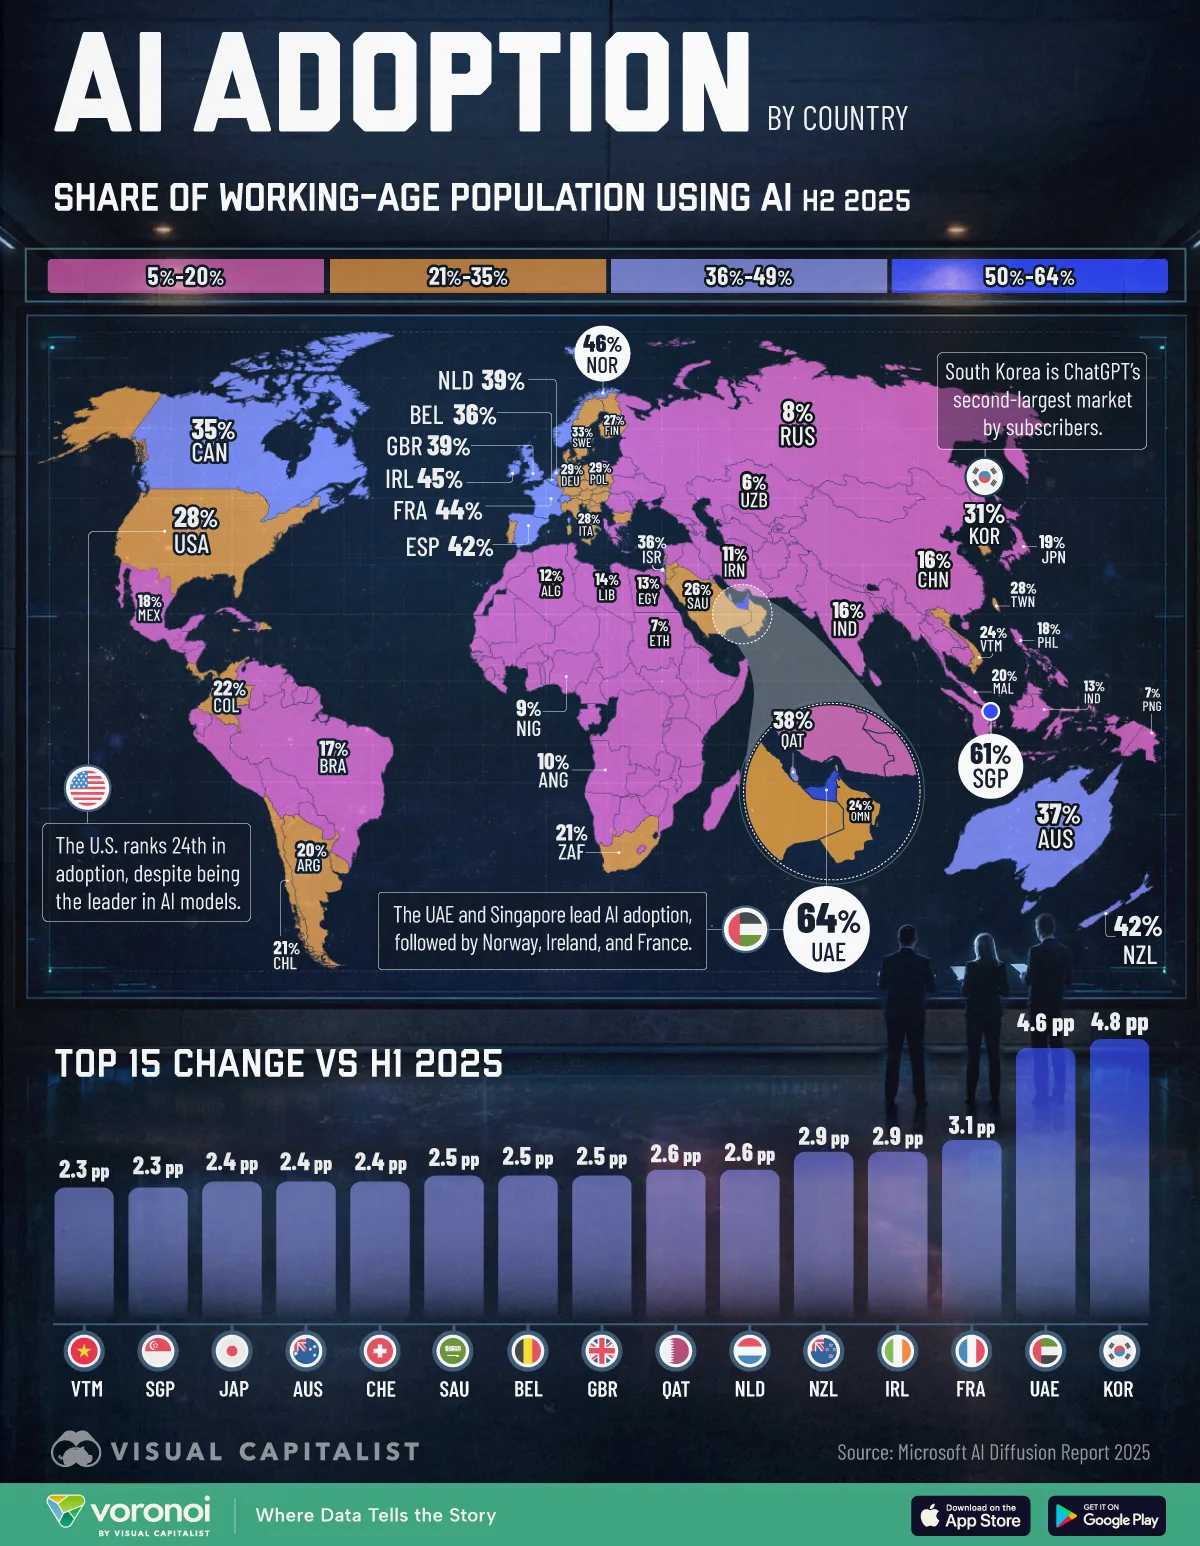
- The UAE has an AI adoption rate of 64.0%, the highest globally in 2025.
- Even though the U.S. is a global leader in AI infrastructure and frontier model development, it ranks 24th in AI adoption based on analysis from Microsoft.
In the second half of 2025, 16.1% of the global working-age population used AI, indicating substantial room for further adoption.
At the same time, usage varies widely across countries. Adoption rates average 24.7% in the Global North, while they are 14.1% in the Global South. Key countries stand as clear regional outliers including the UAE and Singapore.
This graphic shows AI adoption by country, based on data from the Global AI Adoption in 2025 report from Microsoft.
How AI Adoption Rates Compare Worldwide
For the analysis, Microsoft estimated AI usage across 147 countries worldwide.
Below, we show the share of each country’s working-age population that used AI at least once over H2 2025. Additionally, we show the percentage point (p.p.) change compared to H1 2025, representing the absolute difference between the two periods.
| Rank | Country | Share of Working-Age Population Using AI H2 2025 (%) |
Change vs H1 2025 (p.p.) |
|---|---|---|---|
| 1 |  UAE UAE |
64.0 | 4.6 |
| 2 |  Singapore Singapore |
60.9 | 2.3 |
| 3 |  Norway Norway |
46.4 | 1.1 |
| 4 |  Ireland Ireland |
44.6 | 2.9 |
| 5 |  France France |
44.0 | 3.1 |
| 6 |  Spain Spain |
41.8 | 2.1 |
| 7 |  New Zealand New Zealand |
40.5 | 2.9 |
| 8 |  Netherlands Netherlands |
38.9 | 2.6 |
| 9 |  UK UK |
38.9 | 2.5 |
| 10 |  Qatar Qatar |
38.3 | 2.6 |
| 11 |  Australia Australia |
36.9 | 2.4 |
| 12 |  Israel Israel |
36.1 | 2.2 |
| 13 |  Belgium Belgium |
36.0 | 2.5 |
| 14 |  Canada Canada |
35.0 | 1.5 |
| 15 |  Switzerland Switzerland |
34.8 | 2.4 |
| 16 |  Sweden Sweden |
33.3 | 2.1 |
| 17 |  Austria Austria |
31.4 | 2.3 |
| 18 |  South Korea South Korea |
30.7 | 4.8 |
| 19 |  Hungary Hungary |
29.8 | 1.9 |
| 20 |  Denmark Denmark |
28.7 | 2.1 |
| 21 |  Germany Germany |
28.6 | 2.1 |
| 22 |  Poland Poland |
28.5 | 2.1 |
| 23 |  Taiwan Taiwan |
28.4 | 2 |
| 24 |  U.S. U.S. |
28.3 | 2 |
| 25 |  Italy Italy |
27.8 | 1.8 |
| 26 |  Czechia Czechia |
27.8 | 2 |
| 27 |  Bulgaria Bulgaria |
27.3 | 1.9 |
| 28 |  Finland Finland |
27.3 | 1.7 |
| 29 |  Jordan Jordan |
27.0 | 1.6 |
| 30 |  Slovenia Slovenia |
26.5 | 1.4 |
| 31 |  Costa Rica Costa Rica |
26.5 | 1.9 |
| 32 |  Saudi Arabia Saudi Arabia |
26.2 | 2.5 |
| 33 |  Lebanon Lebanon |
25.7 | 0.9 |
| 34 |  Portugal Portugal |
24.2 | 1.6 |
| 35 |  Oman Oman |
24.2 | 1.8 |
| 36 |  Slovakia Slovakia |
23.8 | 1.7 |
| 37 |  Croatia Croatia |
23.7 | 1.9 |
| 38 |  Vietnam Vietnam |
23.5 | 2.3 |
| 39 |  Dominican Republic Dominican Republic |
22.7 | 0.7 |
| 40 |  Uruguay Uruguay |
22.5 | 1.6 |
| 41 |  Lithuania Lithuania |
22.4 | 1.4 |
| 42 |  Jamaica Jamaica |
22.1 | -0.1 |
| 43 |  Colombia Colombia |
22.0 | 1.6 |
| 44 |  Serbia Serbia |
21.5 | 1.2 |
| 45 |  Panama Panama |
21.5 | 1.8 |
| 46 |  South Africa South Africa |
21.1 | 1.8 |
| 47 |  Chile Chile |
20.8 | 1.2 |
| 48 |  Malaysia Malaysia |
19.7 | 1.4 |
| 49 |  Argentina Argentina |
19.6 | 1.8 |
| 50 |  Bosnia and Bosnia andHerzegovina |
19.5 | 1.3 |
| 51 |  Japan Japan |
19.1 | 1.4 |
| 52 |  Kuwait Kuwait |
19.1 | 1.4 |
| 53 |  Greece Greece |
19.1 | 2.4 |
| 54 |  Philippines Philippines |
18.3 | 1.2 |
| 55 |  Georgia Georgia |
18.2 | 0.9 |
| 56 |  Mexico Mexico |
17.8 | 1.1 |
| 57 |  Ecuador Ecuador |
17.7 | 0.7 |
| 58 |  Brazil Brazil |
17.1 | 1.5 |
| 59 |  Moldova Moldova |
17.0 | 0.4 |
| 60 |  Albania Albania |
16.5 | 0.7 |
| 61 |  China China |
16.3 | 0.9 |
| 62 |  El Salvador El Salvador |
16.2 | 0.9 |
| 63 |  Romania Romania |
16.2 | 1.6 |
| 64 |  India India |
15.7 | 1.5 |
| 65 |  Azerbaijan Azerbaijan |
15.5 | 1.3 |
| 66 |  Guatemala Guatemala |
14.8 | 1.1 |
| 67 |  Peru Peru |
14.7 | 1.3 |
| 68 |  Türkiye Türkiye |
14.6 | 1.2 |
| 69 |  Mongolia Mongolia |
14.3 | 1.7 |
| 70 |  Namibia Namibia |
13.8 | 0.8 |
| 71 |  Libya Libya |
13.7 | 1 |
| 72 |  Kazakhstan Kazakhstan |
13.7 | 1 |
| 73 |  Botswana Botswana |
13.7 | 0.9 |
| 74 |  Gabon Gabon |
13.4 | 1.1 |
| 75 |  Egypt Egypt |
13.4 | 0.9 |
| 76 |  Honduras Honduras |
13.1 | 0.7 |
| 77 |  Nepal Nepal |
13.0 | 0.7 |
| 78 |  Senegal Senegal |
12.9 | 0.5 |
| 79 |  Indonesia Indonesia |
12.7 | 1 |
| 80 |  Tunisia Tunisia |
12.7 | 0.4 |
| 81 |  Zambia Zambia |
12.3 | 0.6 |
| 82 |  Algeria Algeria |
12 | 0.7 |
| 83 |  Cote D’Ivoire Cote D’Ivoire |
11.7 | 0.9 |
| 84 |  Bolivia Bolivia |
11.6 | 0.7 |
| 85 |  Iraq Iraq |
11.2 | 0.9 |
| 86 |  Paraguay Paraguay |
11.0 | 0.9 |
| 87 |  Morocco Morocco |
10.9 | 0.4 |
| 88 |  Gambia Gambia |
10.9 | 0.3 |
| 89 |  Thailand Thailand |
10.7 | 1.6 |
| 90 |  Iran Iran |
10.7 | 0.7 |
| 91 |  Nicaragua Nicaragua |
10.7 | 1.1 |
| 92 |  Pakistan Pakistan |
10.3 | 0.6 |
| 93 |  Angola Angola |
9.7 | 0.8 |
| 94 |  Madagascar Madagascar |
9.7 | 0.8 |
| 95 |  Malawi Malawi |
9.7 | 0.8 |
| 96 |  Mozambique Mozambique |
9.7 | 0.8 |
| 97 |  Benin Benin |
9.3 | 0.6 |
| 98 |  Burkina Faso Burkina Faso |
9.3 | 0.6 |
| 99 |  Ghana Ghana |
9.3 | 0.6 |
| 100 |  Guinea Guinea |
9.3 | 0.6 |
| 101 |  Guinea-Bissau Guinea-Bissau |
9.3 | 0.6 |
| 102 |  Liberia Liberia |
9.3 | 0.6 |
| 103 |  Mali Mali |
9.3 | 0.6 |
| 104 |  Mauritania Mauritania |
9.3 | 0.6 |
| 105 |  Niger Niger |
9.3 | 0.6 |
| 106 |  Nigeria Nigeria |
9.3 | 0.6 |
| 107 |  Sierra Leone Sierra Leone |
9.3 | 0.6 |
| 108 |  Togo Togo |
9.3 | 0.6 |
| 109 |  Myanmar Myanmar |
9.1 | 0.3 |
| 110 |  Lesotho Lesotho |
9.1 | 0.7 |
| 111 |  French Guiana French Guiana |
9.0 | -0.1 |
| 112 |  Guyana Guyana |
9.0 | 0.7 |
| 113 |  Suriname Suriname |
9.0 | 0.7 |
| 114 |  Venezuela Venezuela |
9.0 | 0.7 |
| 115 |  Ukraine Ukraine |
9.0 | 0.7 |
| 116 |  Belarus Belarus |
8.4 | 0.8 |
| 117 |  Kyrgyzstan Kyrgyzstan |
8.2 | 0.6 |
| 118 |  Kenya Kenya |
8.1 | 0.3 |
| 119 |  Russia Russia |
8.0 | 0.4 |
| 120 |  Cameroon Cameroon |
7.8 | 0.8 |
| 121 |  Central African Central AfricanRepublic |
7.8 | 0.8 |
| 122 |  Chad Chad |
7.8 | 0.8 |
| 123 |  Congo Congo |
7.8 | 0.8 |
| 124 |  DRC Congo DRC Congo |
7.8 | 0.8 |
| 125 |  Zimbabwe Zimbabwe |
7.6 | 0.5 |
| 126 |  Haiti Haiti |
7.6 | 0.7 |
| 127 |  Papua New Guinea Papua New Guinea |
7.3 | 0.1 |
| 128 |  Bangladesh Bangladesh |
7.1 | 0.4 |
| 129 |  Syria Syria |
7.1 | 0.6 |
| 130 |  Burundi Burundi |
6.8 | 0.4 |
| 131 |  Eritrea Eritrea |
6.8 | 0.4 |
| 132 |  Ethiopia Ethiopia |
6.8 | 0.4 |
| 133 |  Somalia Somalia |
6.8 | 0.4 |
| 134 |  South Sudan South Sudan |
6.8 | 0.4 |
| 135 |  Sudan Sudan |
6.8 | 0.4 |
| 136 |  Tanzania Tanzania |
6.8 | 0.4 |
| 137 |  Uganda Uganda |
6.8 | 0.4 |
| 138 |  Laos Laos |
6.7 | 0.7 |
| 139 |  Armenia Armenia |
6.6 | 0.4 |
| 140 |  Sri Lanka Sri Lanka |
6.6 | 0.4 |
| 141 |  Uzbekistan Uzbekistan |
6.3 | 0.6 |
| 142 |  Rwanda Rwanda |
6.3 | 0.3 |
| 143 |  Cuba Cuba |
6.1 | 0.4 |
| 144 |  Afghanistan Afghanistan |
5.6 | 0.5 |
| 145 |  Tajikistan Tajikistan |
5.6 | 0.5 |
| 146 |  Turkmenistan Turkmenistan |
5.6 | 0.5 |
| 147 |  Cambodia Cambodia |
5.1 | 0.5 |
| — |  World Average World Average |
16.3 | 1.2 |
With 64.0% of the population using generative AI tools, the UAE not only ranks first globally, but stands as one of the fastest-growing countries in adoption.
Even before ChatGPT launched, AI technology was being used across public services in the UAE. This was supported by early governance frameworks that were established in 2017, as part of its national AI strategy targeting nine key sectors.
Ranking in second is Singapore, where 60.9% of the population uses AI. Like the UAE, Singapore invested early in AI infrastructure and research and development.
In Europe, Norway ranks first along with taking third place globally with a 46.4% adoption rate. It is followed by Ireland (44.6%), and France (44.0%), two countries with robust tech ecosystems.
Meanwhile, adoption rates in the U.S. stood at 28.3%, or 24th overall. Interestingly, although the U.S. develops world-class AI research and is home to some of the world’s largest AI-related firms, trust in AI technology is fairly low.
According to the Edelman Trust Barometer, just 32.0% of the U.S. population trusts AI. In comparison, the figure jumps to 67.0% in the UAE.
At the tail end of the adoption spectrum is Cambodia, where it stands at just 5.1%. While progress is underway, limited investment and infrastructure remain key barriers to wider adoption.
Learn More on the Voronoi App 
To learn more about this topic, check out this graphic on AI compute hubs by country.